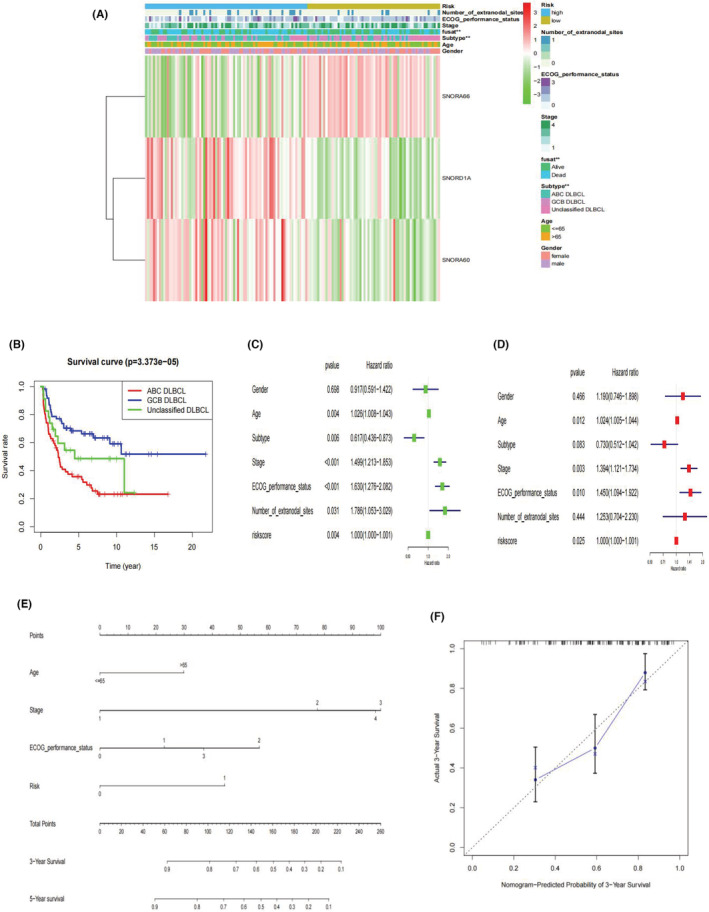
FIGURE 4.

(A) Correlation of candidate snoRNAs expression, risk‐score, and the clinicopathologic information shown in the cluster heatmap. Red color for snoRNA refers to high risk score, whereas green color for snoRNA means low risk score. The levels of color referred to the value risk score. The other colors matched to different features that were noted in the figure legends. (B) K‐M survival analysis of different DLBCL subtypes in GSE11318. (C, D) Independent prognostic analysis of snoRNA risk model in DLBCL: Forest plot of univariate and multivariable cox analysis. (E) Nomogram for independent prognostic factors (three‐snoRNA signature, age, stage and ECOG performance status) to predict 3‐, or 5‐year survival probability in DLBCL. Each variable was assigned a score according to its contribution to the prognosis of DLBCL (Age: <=65, 0 points; >65, 30 points. Stage: 1, 0 points; 2, 77 points; 3, 100 points; 4, 98 points. ECOG performance status: 0, 0 points; 1, 23 points; 2, 57 points; 3, 37 points; Risk model: 0, 0 points; 1, 44points). Then, total points were obtained by adding single point of each variable and used for predicting the probability of the clinical ending for individual or clinical outcome. (F) Calibration curves of nomogram‐predicted probability for 3‐year overall survival
