
FIGURE 3.
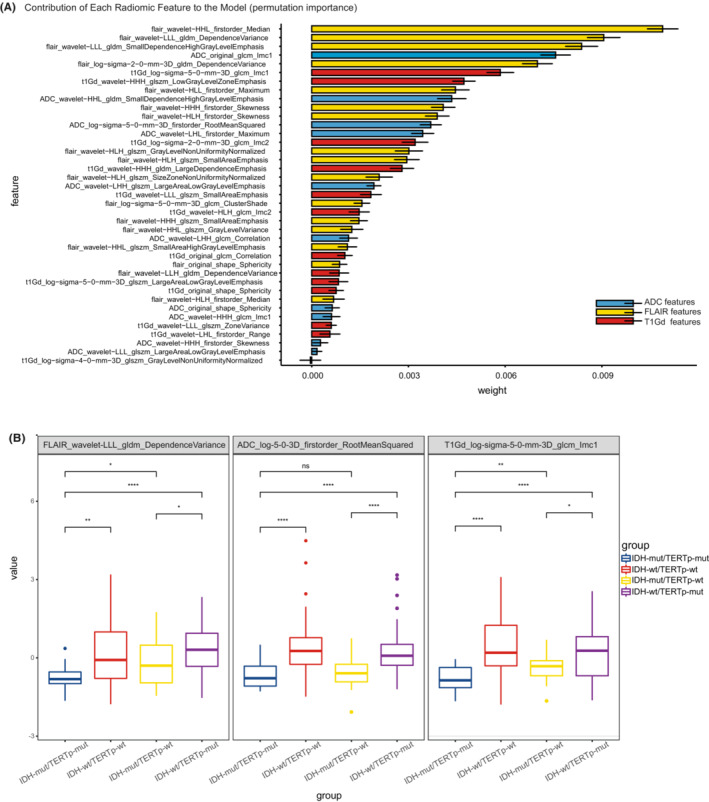
Feature importance and comparison of key feature values. (A) The contribution of IDHmut pTERTmut glioma‐specific radiomic features to the diagnostic model was estimated using the ELI5 package. The error bars in the figures were shown as standard deviations of weights in 200 random training/test set splits. (B) Boxplot of feature values. The value of key radiomic features in each sequence among IDHmut/pTERTmut and other groups were compared using the Mann–Whitney test (*p value <0.05, **p value <0.01, ***p value <0.001, ****p value <0.0001). Abbreviations: GLCM, gray‐level co‐occurrence matrix; GLDM, gray level dependence matrix; GLSZM, gray‐level size zone matrix; LoG, Laplacian of Gaussian.