
FIGURE 2.
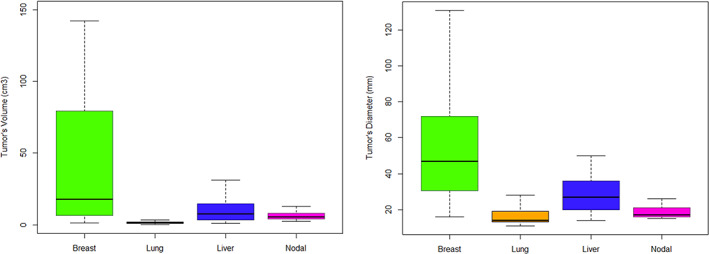
Boxplots showing distribution of tumor size at baseline per location of the disease (breast, lung, liver and nodal) with tumor volume (cm3) on the left and tumor diameter (mm) on the right. Breast tumors were larger, p < 0.001 for volume or diameter using Tukey Honest Significant Difference test.