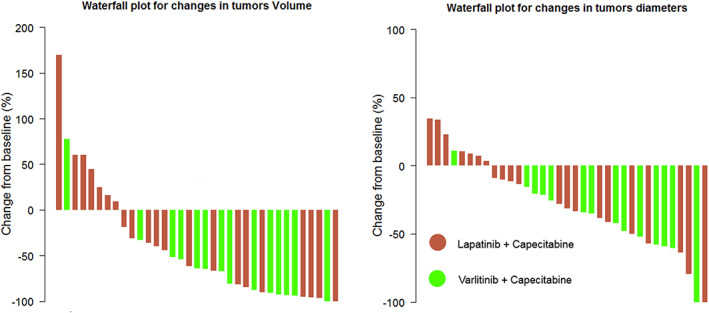
FIGURE 3.

Waterfall plot showing changes from baseline at Week 12 in tumor volume (on left) and tumor diameter (on right). Green bars represent responses in the Varlitinib + Capecitabine arm; red bars represent responses in the Lapatinib + Capecitabine arm.
