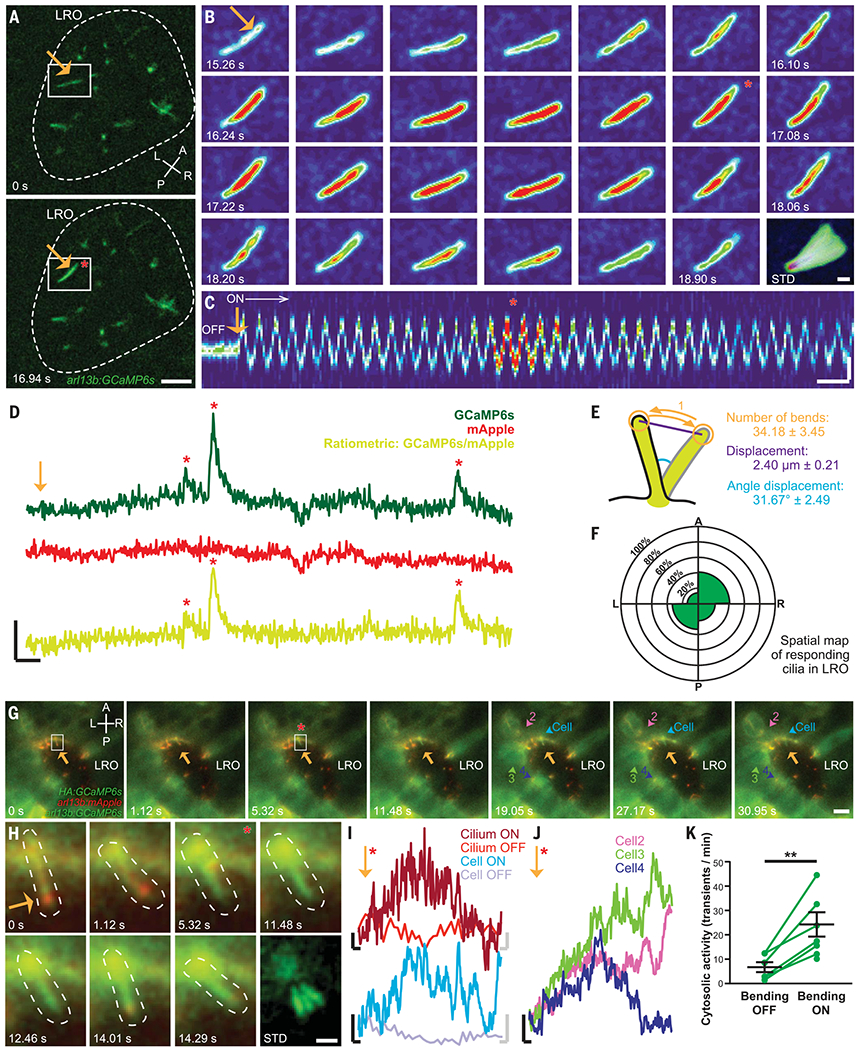
Fig. 2. Oscillatory mechanical stimuli on LRO cilia activate intraciliary calcium transients.

(A) Representative images of the LRO of a c21orf59 morphant zebrafish. Dashed line: LRO. Scale: 10 μm. (B) Representative montage of the GCaMP6s-positive LRO cilium highlighted in (A). Scale: 2 μm. (C) Kymograph of the cilium shown in (B) before (“OFF”) and during optical bending (“ON”, white arrow, starting at orange arrow). Scales: vertical: 2 μm; horizontal: 2 s. (D) Intraciliary intensity over time plots of a single LRO cilium exhibiting intraciliary calcium oscillations of different amplitudes in response to optical bending. Scales: vertical: 50% ΔF/F; horizontal: 5 s. (E) Optical bending characteristics associated with responding LRO cilia. Mean ± S.E.M, n = 23 responses analyzed. (F) Spatial mapping of ciliary responses in the c21orf59 embryos. Mean percentage of ciliary responses to optical bending in each region of the LRO (n = 88 cilia from 12 embryos). No statistical differences were observed between LRO regions (Fisher’s exact tests with Bonferroni correction, all P > 0.05). (G) Representative montage of cytosolic calcium responses (colored arrowheads) following the intraciliary calcium response of a LRO cilium (white box) to oscillatory optical bending (orange arrow). Scale: 10 μm. (H) Representative montage of the cilium (dashed line) highlighted in (G). Scale: 2 μm. (I) GCaMP6s intensity over time plots of the cilium bent in (G) and (H) and in the connected cell (G), before (OFF) and after (ON) the start of the optical mechanical stimulation. Black scales for ON traces: vertical: 20% ΔF/F; horizontal: 2 s. Gray scales for OFF traces: vertical: 20% ΔF/F; horizontal: 0.3 s. (J) GCaMP6s intensity over time plots of the responding cells highlighted in (G). (K) Mean frequency of cytosolic activity (number of calcium transients per minute) at rest before bending (bending OFF) and during bending by the optical tweezers (bending ON) in c21orf59 embryos (n = 6 morphants). **P < 0.01 (P-value = 0.0044), paired two-tailed t-test. A, anterior; P, posterior; L, left; R, right; LRO, left-right organizer. Orange arrows: optical mechanical stimulation; red asterisks: start of the intraciliary response; numbers: time after start of the bend; STD: standard deviation Z-projection of montage.
