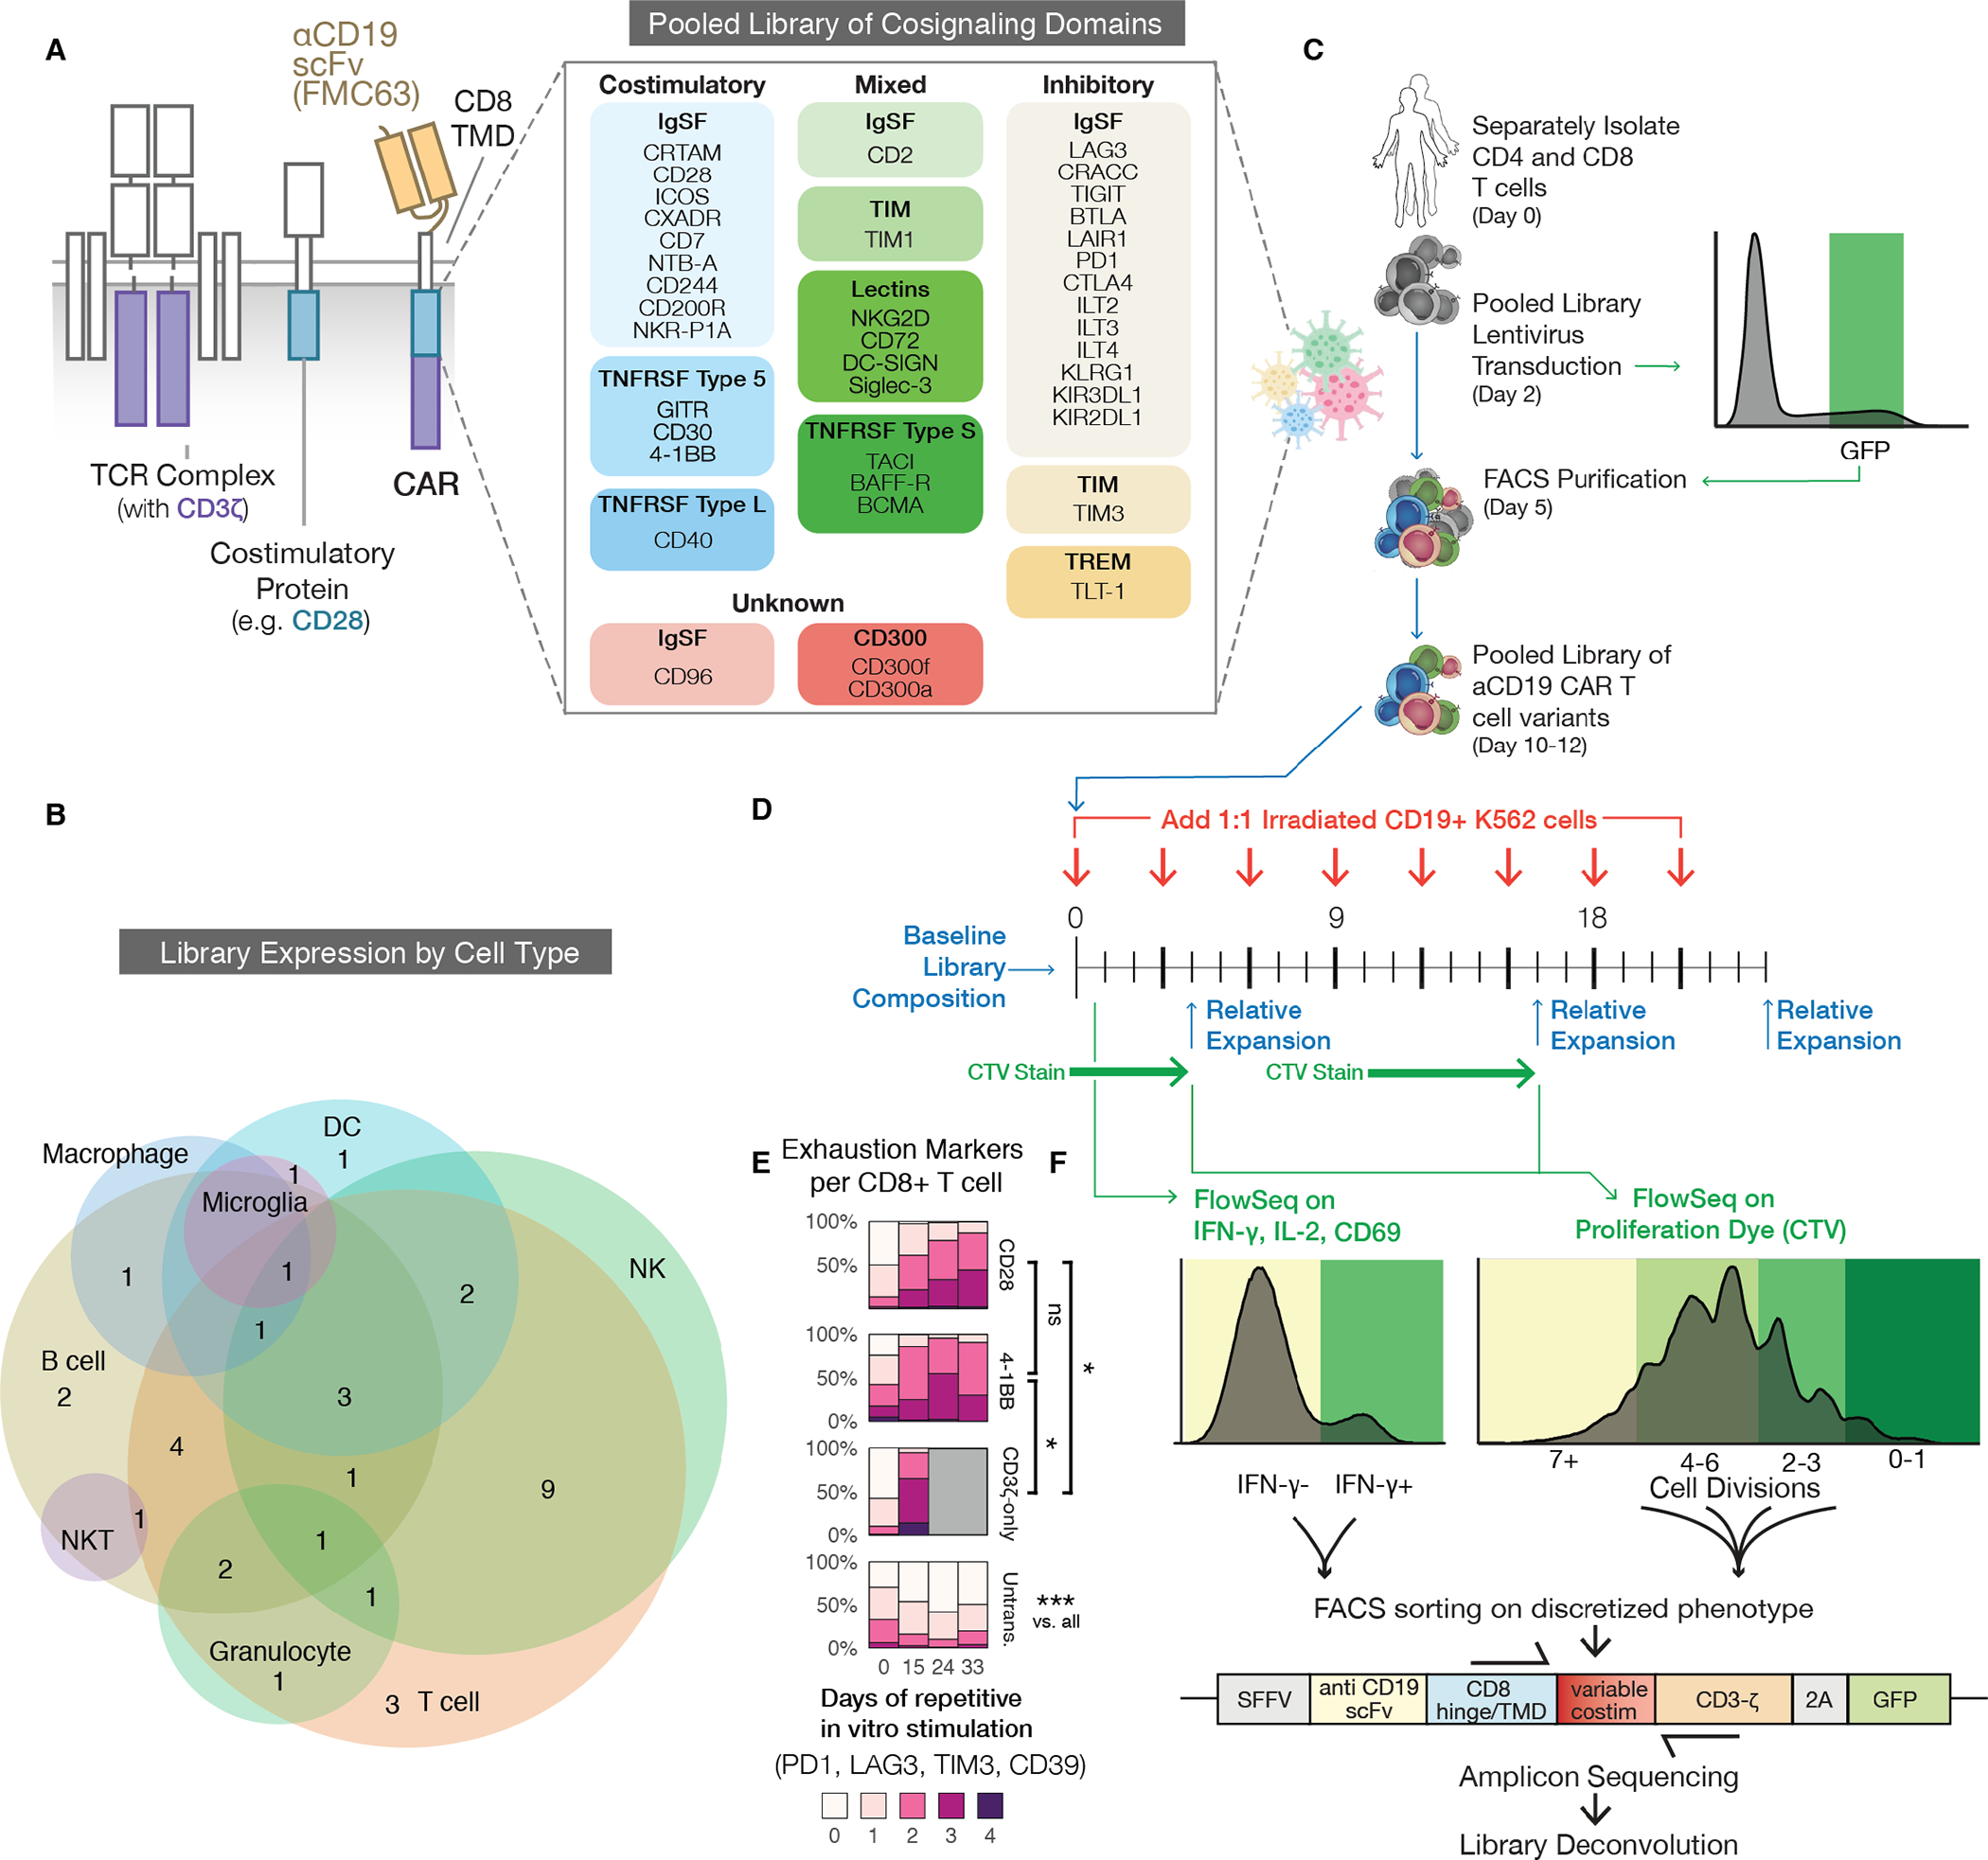
Fig. 1. Generation and screening of a pooled library of CARs with diverse signaling domains.

(A) Our CARs combine an αCD19 ScFv (FMC63), a CD8 hinge and transmembrane domain (TMD), an intracellular signaling domain, and a CD3ζ domain (left). Forty domains from across the human proteome were codon-optimized, synthesized, pooled into a plasmid library, and packaged to generate lentivirus (right). These spanned protein families such as immunoglobulin superfamily (IgSF), T cell/transmembrane, immunoglobulin, and mucin (TIM), TNF receptor super family (TNFRSF), and triggering receptors expressed on myeloid cells (TREM). (B) A Venn diagram showing natural expression of library members across immune cell types. Expression patterns are listed in table S1. NK, natural killer cell; NKT, natural killer T cell; DC, dendritic cell. (C) Primary human CD4 and CD8 T cells were separately isolated from PBMCs for two human donors and lentivirally transduced with the library. The cells were FACS purified using T2A-GFP fluorescence within one log of mean expression to reduce variability. (D) The pooled library was repeatedly stimulated 1:1 with CD19+ or CD19- irradiated K562 tumor cells to quantify antigen specific activation (CD69), cytokine production (IFN-γ, IL-2), and proliferation (CTV: CellTrace Violet). The library was also sequenced at the specified timepoints to measure relative expansion of individual constructs. (E) Percentage of CD8+ T cells expressing different numbers of exhaustion markers (PD1, TIM3, LAG3, CD39) after a repeat stimulation assay with CD19+ irradiated K562 tumor cells. T cells expressing CD28, 4-1BB, or CD3ζ-only CARs are compared to untransduced (Untrans.) cells. Grey boxes correspond to timepoints in which no live cells remained. Significance was assessed in CD8 T cells for 2 donors using a Repeated Measures ANOVA model. FDR-corrected p < 0.05:*, p<0.001:***; ns, not significant. The second donor and data for CD4+ T cells are shown in fig. S1 A and B. (F) We used FlowSeq, a FACS and next generation sequencing (NGS)-based pooled quantification workflow, to quantify enrichment by sorting the library into bins of fluorescent signal corresponding to a functional readout, as shown by the colored histograms. We then amplified the costimulatory domain by genomic DNA extraction and PCR, and performed amplicon sequencing on each bin to estimate the phenotype for each library member.
