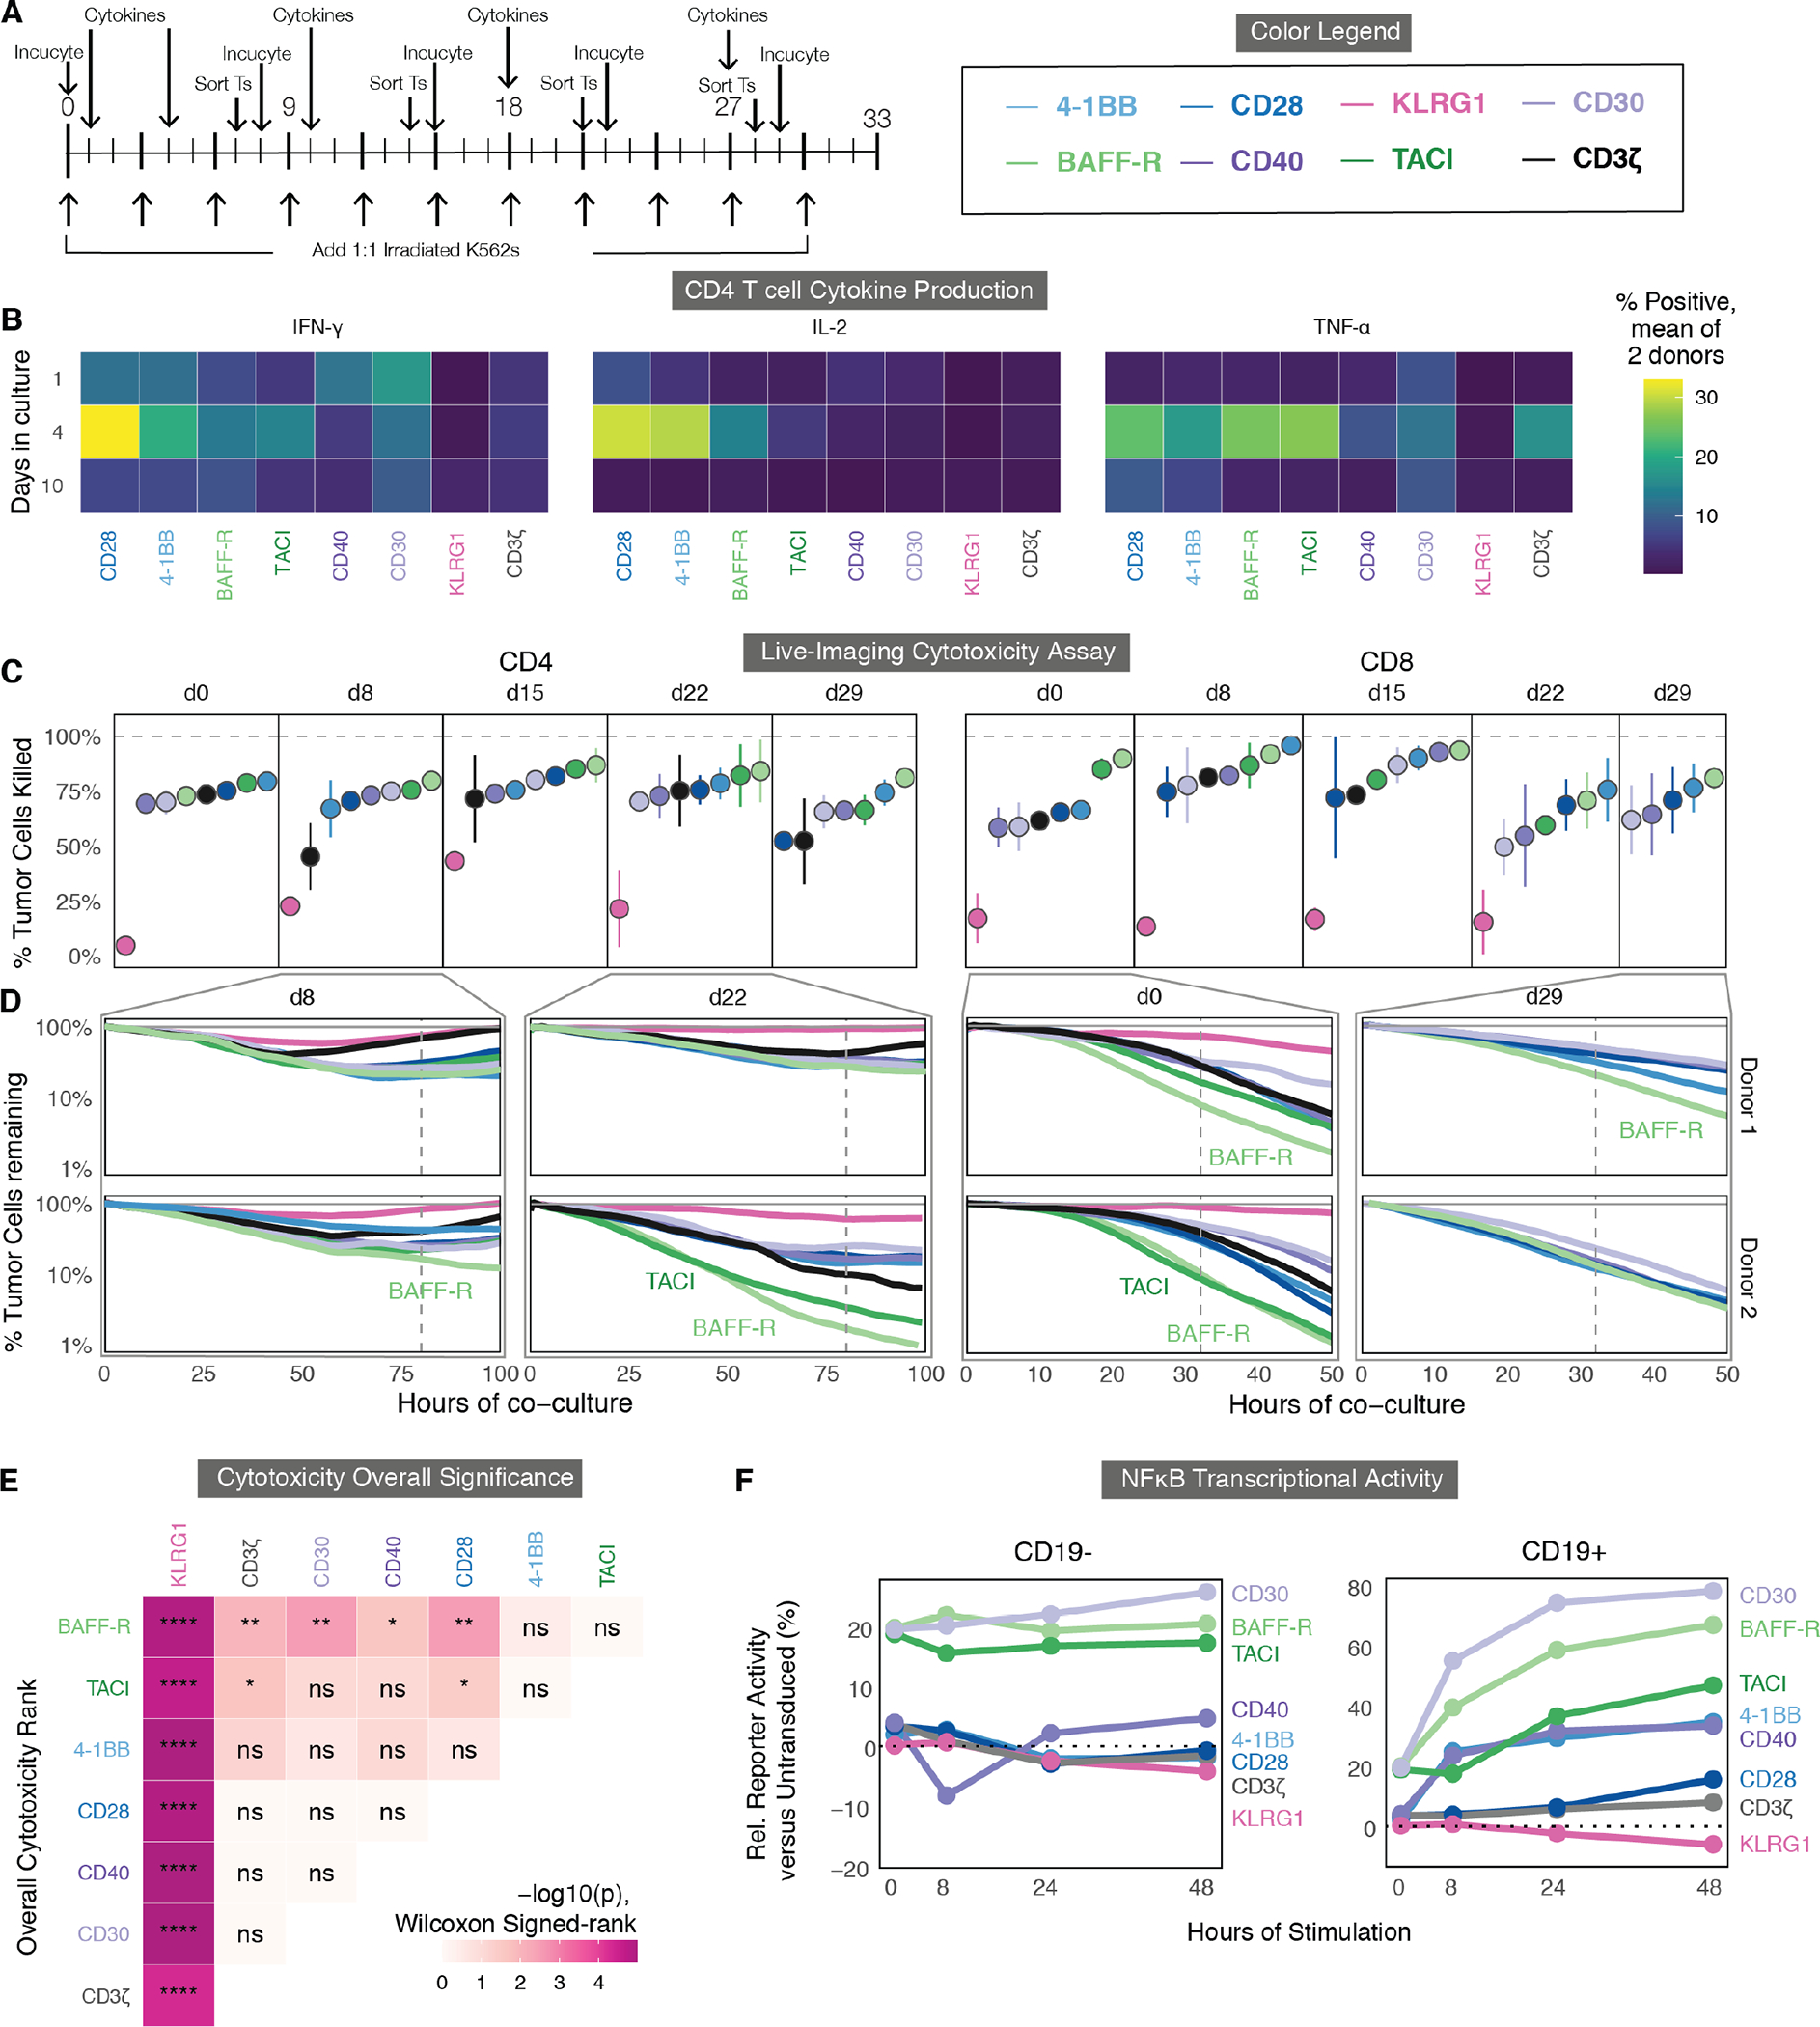
Fig. 5. Comparison of signaling domains across measures of cytokine secretion, T cell signaling reporters, in vitro cytotoxicity, and in vivo solid tumor clearance.

(A) Timeline for in vitro cytotoxicity and cytokine production assays. CD4 or CD8 T cells were transduced and stimulated as in Fig. 4A. Once weekly, a portion were stained for cytokine production as described in (B). For cytotoxicity assays, a portion of T cells (Ts) were sorted from the same co-culture by FACS, rested overnight, then cultured 1:1 with mKate+ CD19+ K562 cells and imaged every 60 minutes by Incucyte for the next 3 to 5 days (C and D). The color legend is shown on the right. (B) Mean cytokine production by CD4 T cells at 1, 4, and 10 days, measured across two donors by intracellular cytokine staining. Percentage of cytokine-positive cells was averaged between two donors. (C) Cytotoxicity of CD4 or CD8 CAR T cells sorted at the indicated days was quantified at 80 and 32 of co-culture respectively, by calculating the percentage of tumor cells at each time point relative to no T cells. CARs are ranked from least to most cytotoxic for each day. Error bars indicate the standard error calculated across donors. (D) Representative plots of cytotoxicity are shown for two donors’ CAR T cells sorted at day 8 and day 22 for CD4 T cells and day 0 and day 29 for CD8 T cells, plotting the percentage of mKate+ tumor cells remaining relative to a well with no T cells (gray). Vertical dashed lines indicate the time points analyzed in (C). (E) Overall significance is shown for the cytotoxicity of CD4 and CD8 T cells from two donors for all days indicated above. Data were analyzed using a Wilcoxon signed-rank test and FDR-corrected; p<0.05:*, p<0.01:**, p<0.001:***, p<0.0001:****; ns, not significant. (F) NFκB transcriptional activity was determined using a reporter Jurkat cell line transduced with each CAR and stimulated with either CD19- or CD19+ K562s. Samples were assessed by flow cytometry. The y-axis is relative (Rel.) to untransduced cells.
