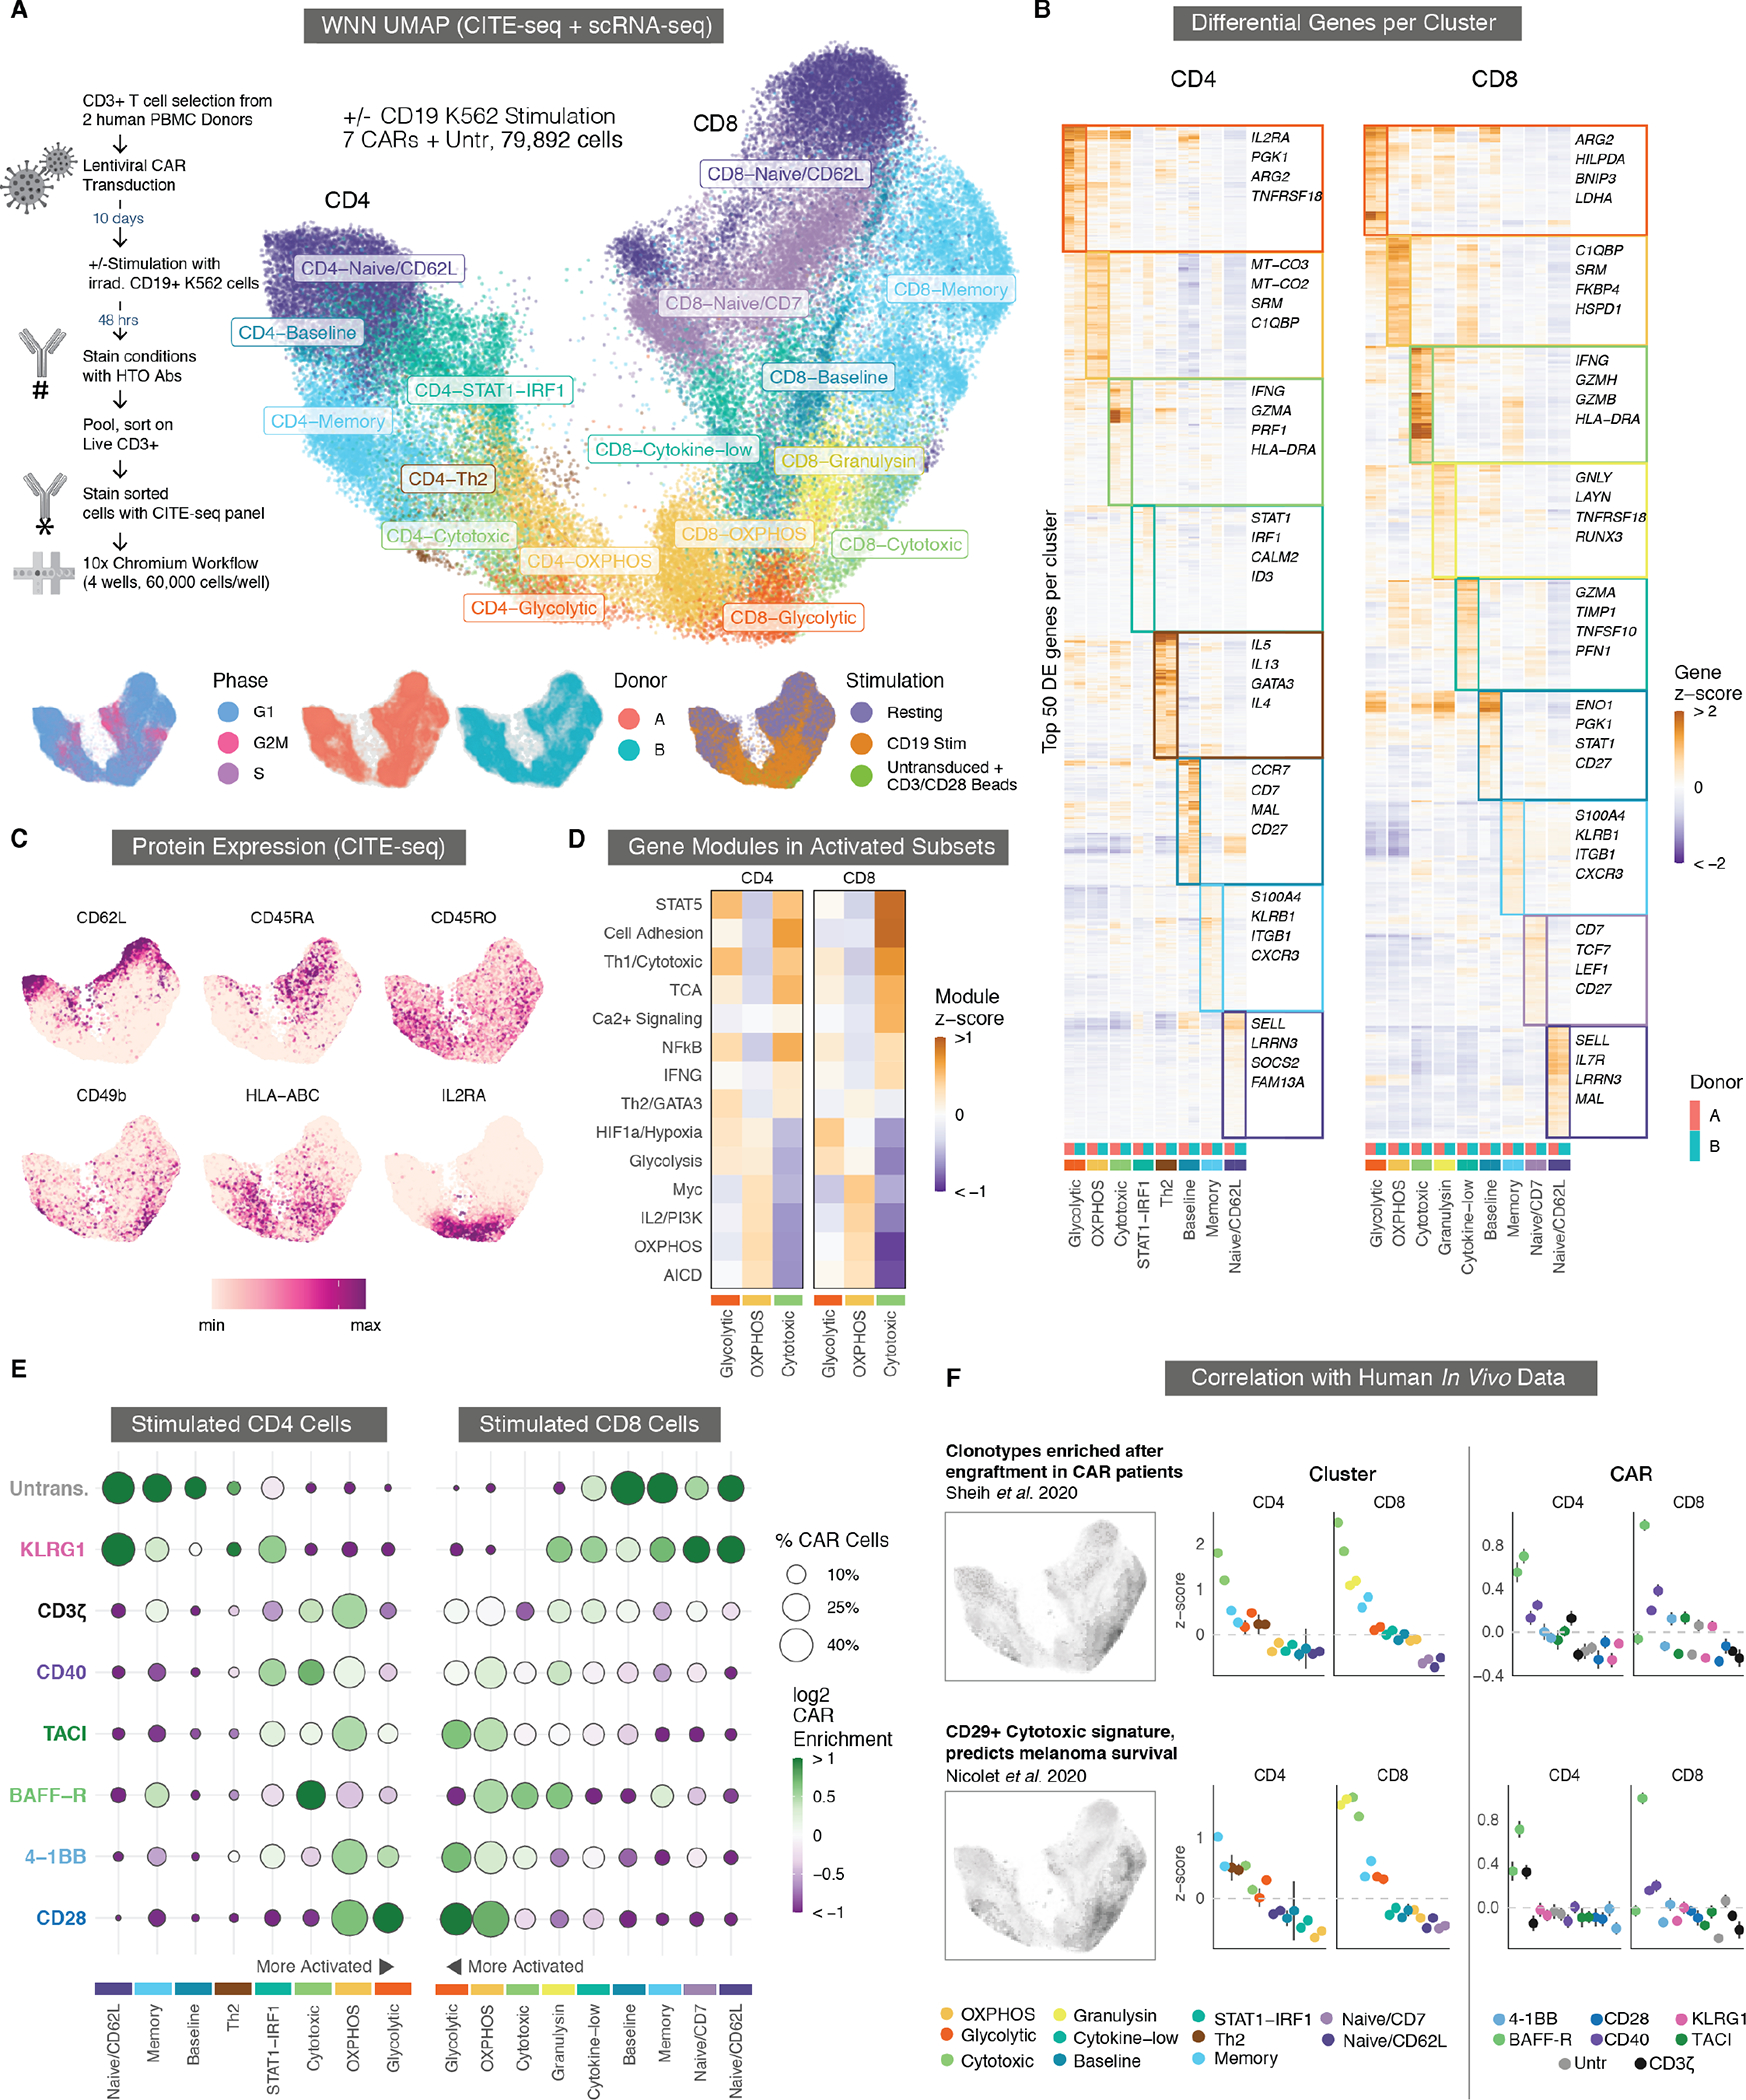
Fig. 6. Single-cell RNA-seq and CITE-seq characterize functional differences between CAR costimulatory domains.

(A) Weighted-nearest neighbor (WNN) Uniform Manifold Approximation and Projection (UMAP) embedding of scRNA-seq and CITE-seq data from stimulated and resting CAR T cells are shown for samples from two donors. UMAP separates into CD4 and CD8 lobes (left and right sides). Cells are colored by eight CD4 and nine CD8 phenotypic clusters. Bottom inset: Cells colored by cell cycle phase, donor identity, and stimulated versus resting cells. fig. S6A shows the UMAP faceted for each CAR and stimulation condition. (B) Heatmap of differentially expressed (DE) genes. For each cluster, the top 50 DE genes are ordered by hierarchical clustering of the pseudo-bulk expression z-scores for all clusters and donors. Genes in multiple clusters are only included for the cluster with the highest score. For each, four genes that are representative of the overall phenotype of the cluster are highlighted. (C) UMAP plots show relative CITE-seq expression for the surface expression of six markers associated with T cell differentiation and activation. HLA, human leukocyte antigen; IL2RA, IL-2 receptor subunit α. (D) Mean z-scores are shown for MSigDB gene modules associated with various aspects of T cell activation, metabolism, and signaling among the three major activated phenotypic clusters in CD4 and CD8 T cells. TCA, tricarboxylic acid cycle; HIF1a, hypoxia inducible factor 1 subunit alpha; OXPHOS, oxidative phosphorylation; AICD, activation-induced cell death. (E) Enrichment of stimulated CAR T cells containing different signaling domains within each phenotypic cluster. The size of each dot corresponds to the percentage of stimulated CAR T cells in a cluster and with a costimulatory domain. The color of each dot corresponds to the log2 enrichment or depletion of that CAR relative to others. Clusters are arranged with the most activated at the center to correspond to the (A) UMAP. Similar plots for resting cells and a per-donor breakdown are in fig. S6C and E, respectively. (F) Correlation of T cell gene signatures indicative of enhanced CAR T engraftment (top) and melanoma survival (bottom) with phenotypic clusters in CD4 and CD8 CAR T cells (middle column) or with CARs containing different costimulatory domains (right column). Cluster and CAR colors match those in (E). The two dots per group correspond to two separate donors. Error bars indicate 99% confidence intervals for the z-scores.
