Fig. 1.
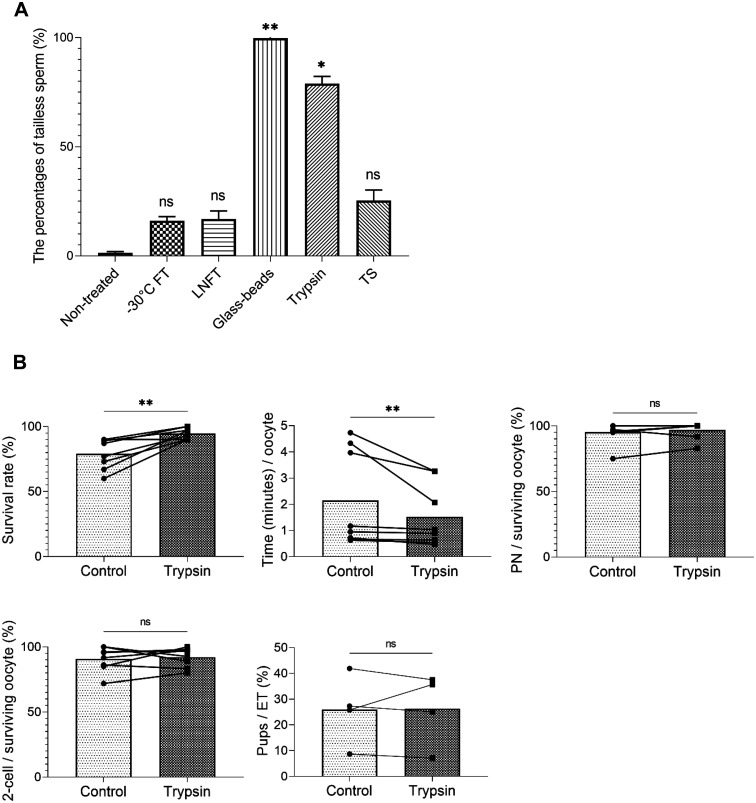
Comparison of the efficiency of sperm tail removal between treatments, and the comparison of two different ICSI methods, conventional and trypsin treatment with pre-activated oocytes. (A) The percentage of tailless sperm in sperm suspensions after each treatment. All treatments could remove the sperm tail, but the efficiency varied. non-treated control: non-treated, –30°C freeze-thawed: –30°CFT, liquid nitrogen freeze-thawed: LNFT, glass bead homogenized: glass beads, trypsin-treated: trypsin, and TrypLETM Select-treated: TS. * P ≤ 0.05, ** P ≤ 0.01, ns P > 0.05 using Kruskal–Wallis test with Dunn’s multiple comparisons test. Mean ± SD. (B) Comparison of control conventional ICSI and ICSI with trypsin-treated sperm with pre-activated oocytes. Eight operators with different ICSI technical experience performed both ICSI methods. Survival rate (%) refers to the oocyte survival rate after sperm injection. Time (min)/oocyte denotes the required time for sperm injection per one oocyte. PN/surviving oocyte (%) and 2-cell/surviving oocyte (%) indicate the rate of ICSI embryos that developed into PN and 2-cells among the surviving oocytes, respectively. Pups/ET (%) corresponds to the litter size rates from ICSI embryos that were transferred into pseudo-pregnant females. Time (min)/oocyte, survival rate (%), PN/surviving oocyte (%), and 2-cell/surviving oocyte (%) in control and trypsin treatment. n = 8. Pups/ET (%) in control and trypsin treatment. n = 4. Normality was tested with the Shapiro–Wilk test. ** P ≤ 0.01, ns P > 0.05 using Wilcoxon test (Time (min)/oocyte, PN/surviving oocyte (%)) and paired t-test (survival rate (%), 2-cell/surviving oocyte (%), pups/ET (%)). See Supplementary Table 1 for the original data for the graphs of Fig. 1B. All data were analyzed using the Prism 9 software (GraphPad, San Diego, CA).

