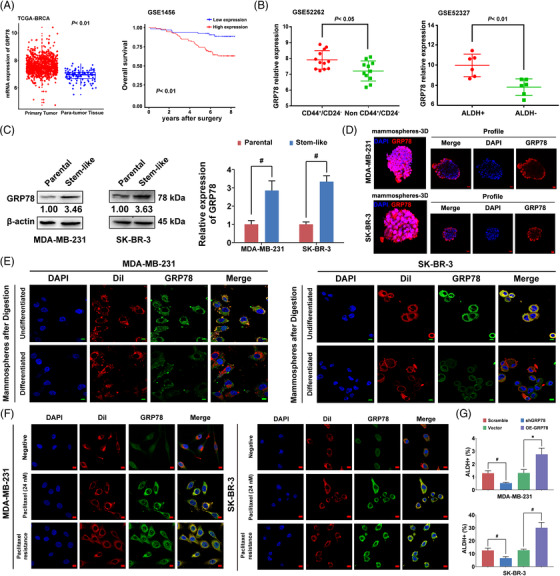
FIGURE 1.

GRP78 positively regulates breast CSCs. (A) Comparative analysis of GRP78 gene expression between the primary tumour tissues and para‐tumour tissues from a cohort of TCGA breast cancer patients (upper panel). Overall survival curves were constructed according to GRP78 levels using the GEO database (lower panel, GSE1456). (B) GRP78 expression was compared between CD44+/CD24− breast CSCs (n = 12) and non‐CD44+/CD24− ones (n = 11) using the GEO database (GSE52262, upper panel). The GRP78 expression of ALDH+ breast cancer stem‐like cells (n = 6) and ALDH− ones (n = 6) were also compared in the GEO database (GSE52327, lower panel). (C) ALDH+ cells were isolated as breast cancer stem‐like cells to detect the GRP78 expression and compared with the unsorted breast cancer cells. (D) The fluorescence of GRP78 expression on the surface of the mammospheres was displayed in the confocal 3D imaging (upper panel). The scale bars indicate 20 μm. Fluorescence changes of GRP78 expression following mammospheres differentiation were also detected (lower panel). The scale bars indicate 50 μm. (E) The mammospheres were digested into single cells before performing an immunofluorescence analysis. A part of single‐cell suspensions was collected for immunofluorescence analysis directly (undifferentiated). The other part was differentiated in the plain culture well for 48 h before immunofluorescence detection. Thus, the fluorescence intensities of GRP78 were compared before and after differentiation. The cell membrane was visualised with Dil staining (red) and merged with GRP78 (green). The scale bars indicate 10 μm. (F) Representative fluorescence imaging of GRP78 localisation in paclitaxel treatment or paclitaxel‐resistant MDA‐MB‐231 and SK‐BR‐3 cells. The cell membrane was visualised with Dil staining (red) and merged with GRP78 (green). The scale bars indicate 10 μm. (G) ALDH+ cells were detected in GRP78 overexpression and knockdown cells compared with their empty vector or scrambled shRNA control. Data were represented as mean ± SD. For statistical analysis, Wilcoxon test (A) and unpaired two‐sided Student's t test (B, C, G) were applied. * p < .05, # p < .01. OE‐GRP78: GRP78 overexpression; shGRP78: GRP78 knockdown
