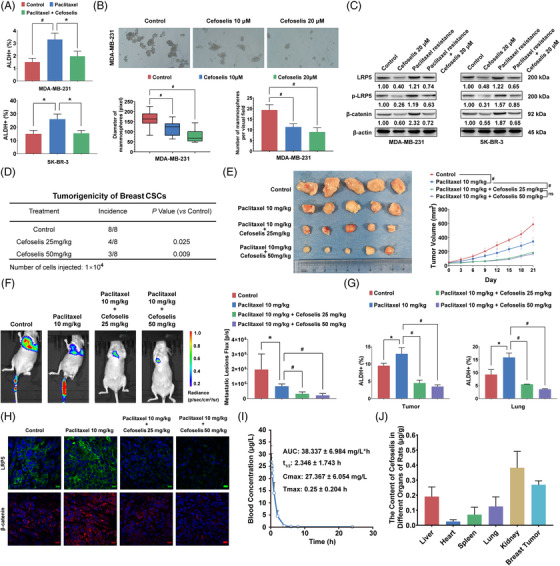
FIGURE 3.

Cefoselis limits breast CSCs with high safety and targeted characteristic. (A) ALDH+ frequency of MDA‐MB‐231 and SK‐BR‐3 was detected by flow cytometry following treatment with paclitaxel (24 nM) alone or cefoselis (20 μM) combination for 6 h. (B) MDA‐MB‐231 and SK‐BR‐3 cells were cultured in ultralow attachment plates with the conditioned medium for mammosphere formation. The number and size of mammospheres in both cell lines were quantified under 10 and 20 μM cefoselis treatment. (C) LRP5, p‐LRP5, and β‐catenin expression were measured in paclitaxel‐resistant cells following cefoselis (20 μM) treatment. (D) The CD44+/CD24−/low subpopulation of SK‐BR‐3 cells was sorted and inoculated into the mammary fat pads of NOD/SCID mice at the density of 1×10. 4 The tumour incidence was identified and quantified following treatment with 25 and 50 mg/kg cefoselis (n = 8). (E) Orthotopic breast cancer xenograft was established as mentioned above. The left panel is the representative image of tumours separated from Balb/c nude mice. The right panel is the tumour growth curve (n = 5). (F) The bioluminescence of the lung colonisation was imaged (left panel) and quantified (right panel) (n = 4). (G) ALDH+ stem‐like cells in primary tumour tissues and lung metastasis lesions were analysed by flow cytometry (n = 3). (H) LRP5 and β‐catenin expression in primary tumour tissues of each group were detected by immunofluorescence assay (the scale bars indicate 10 μm). (I) SD rats (n = 6) were injected with 50 mg/kg cefoselis via tail vein. Pharmacokinetic curves were recorded, and the pharmacokinetic parameters were calculated. (J) Breast cancer‐bearing mice (n = 6) were administered 25 mg/kg cefoselis by intraperitoneal injection, and the tissue distribution of cefoselis was detected 1 h later. Data were represented as mean ± SD. For statistical analysis, one‐way ANOVA and Bonferroni as post hoc test (A, B), Wilcoxon test (D), ANOVA for repeated measurements (E), and unpaired Student's t tests (F, G) were applied. * p < .05, # p < .01
