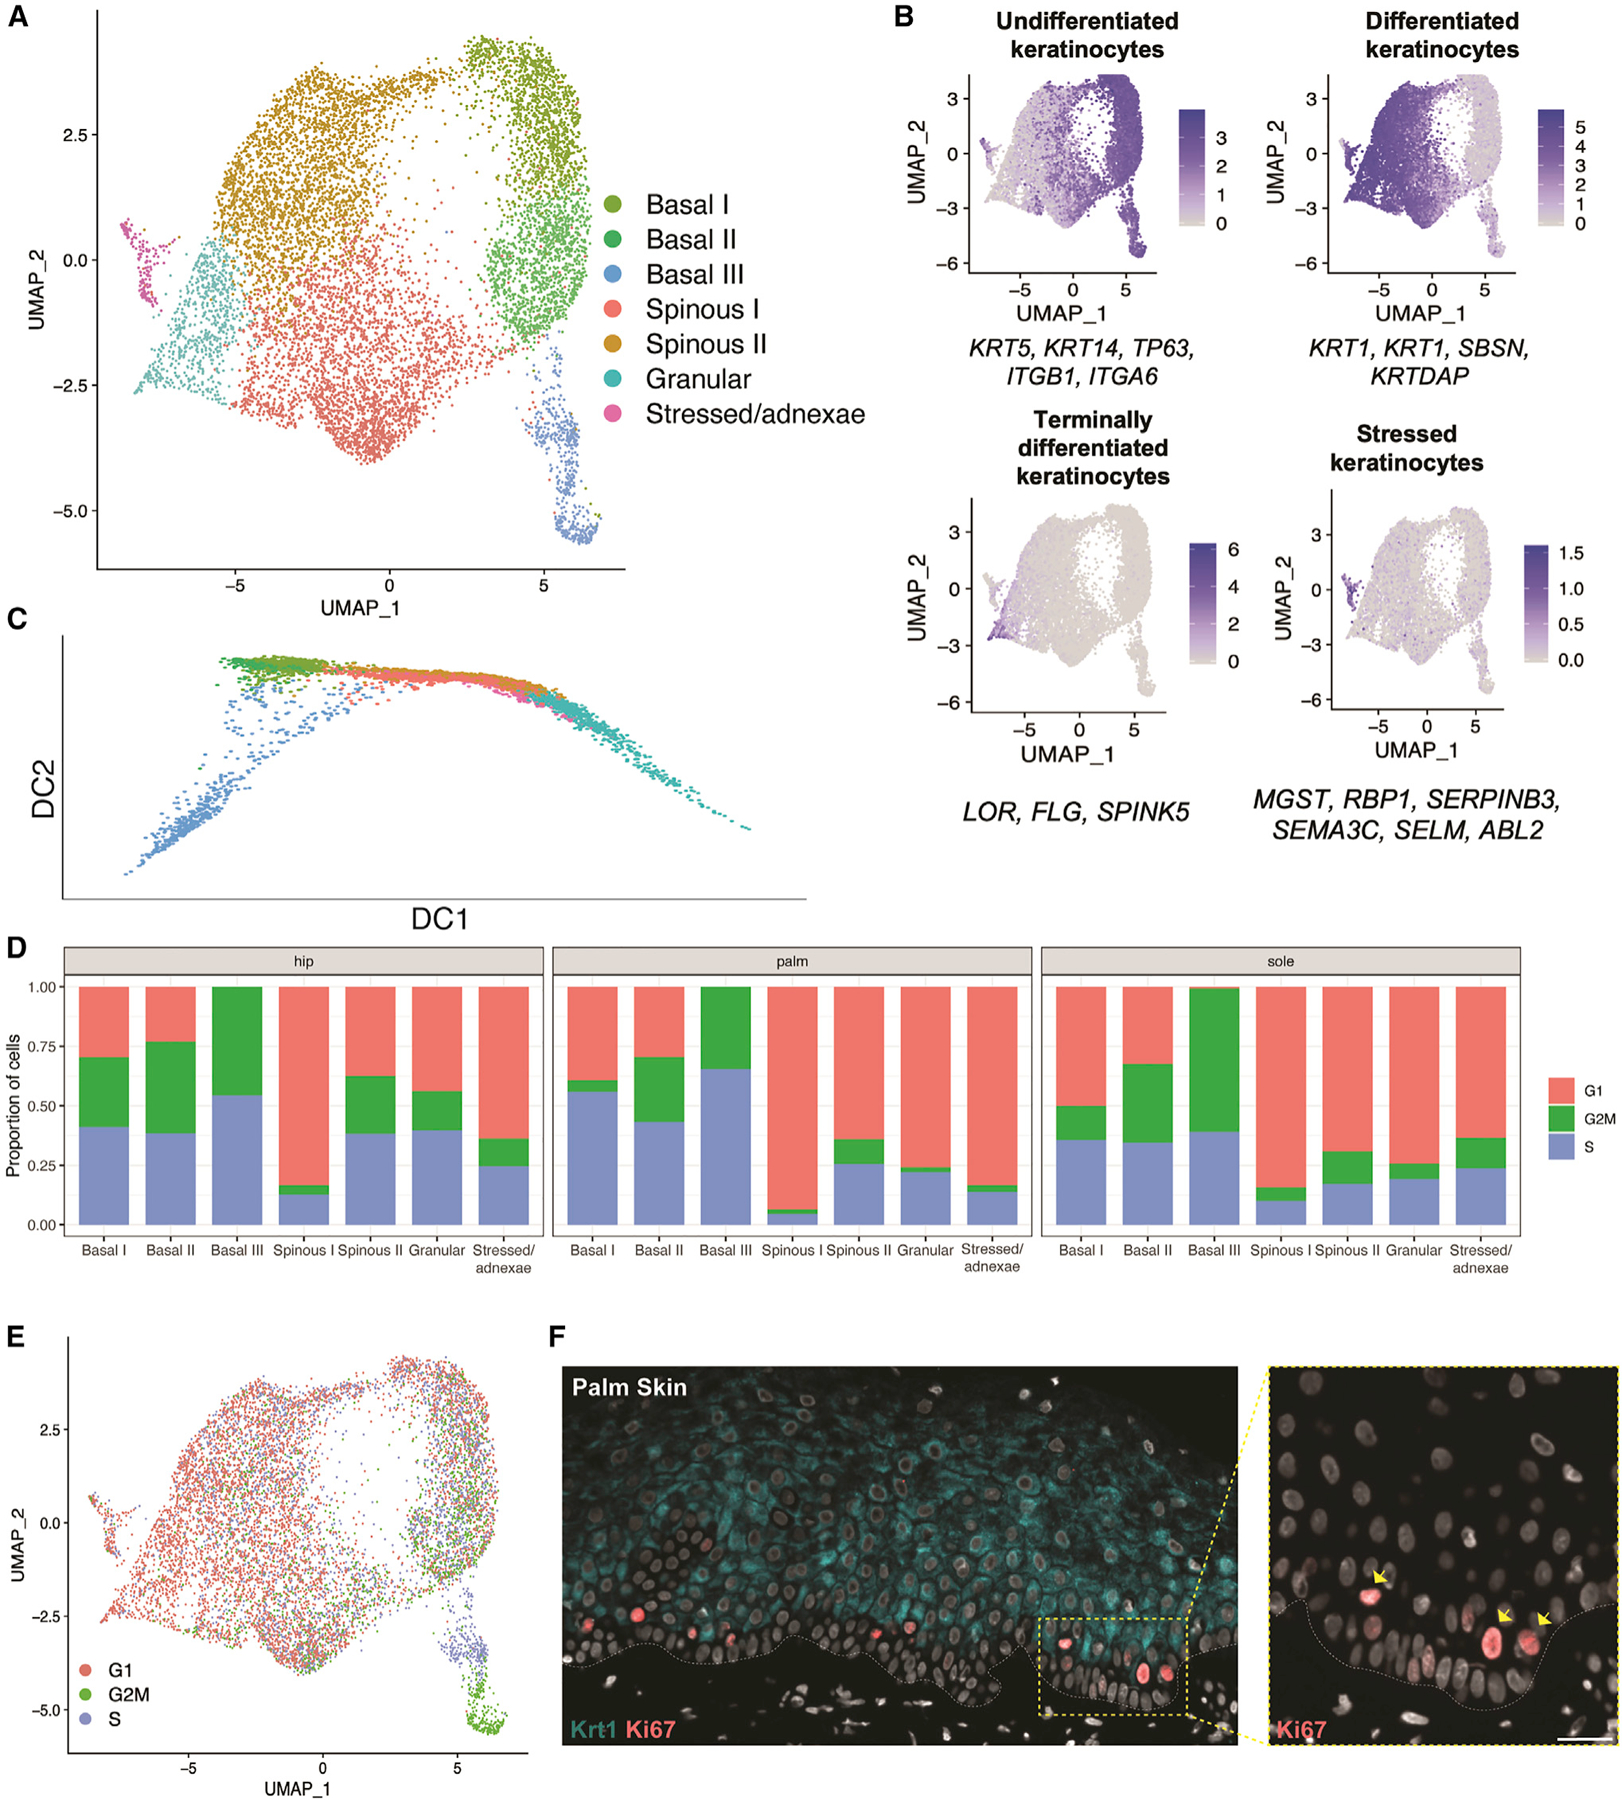
Figure 4. Consistent keratinocyte populations are detected in adult skin.

(A) UMAP visualization of keratinocyte subclusters. Each dot represents a single cell (n = 9,801).
(B) Average expression of three to six established keratinocyte marker genes projected onto UMAP plots to identify keratinocyte subclusters.
(C) Diffusion map of keratinocyte subpopulations.
(D) Proportion of cells in each cell-cycle phase (as assigned by the CellCycleScoring function in Seurat) split by site and keratinocyte subcluster.
(E) Keratinocyte UMAP colored by cell-cycle phase.
(F) Co-immunostaining in the palm skin of proliferation marker Ki67 and differentiation marker KRT1. Inset: arrows indicating suprabasal and basal Ki67-positive cells. White dotted line, dermal-epidermal junction. Scale bar: 60 μm.
