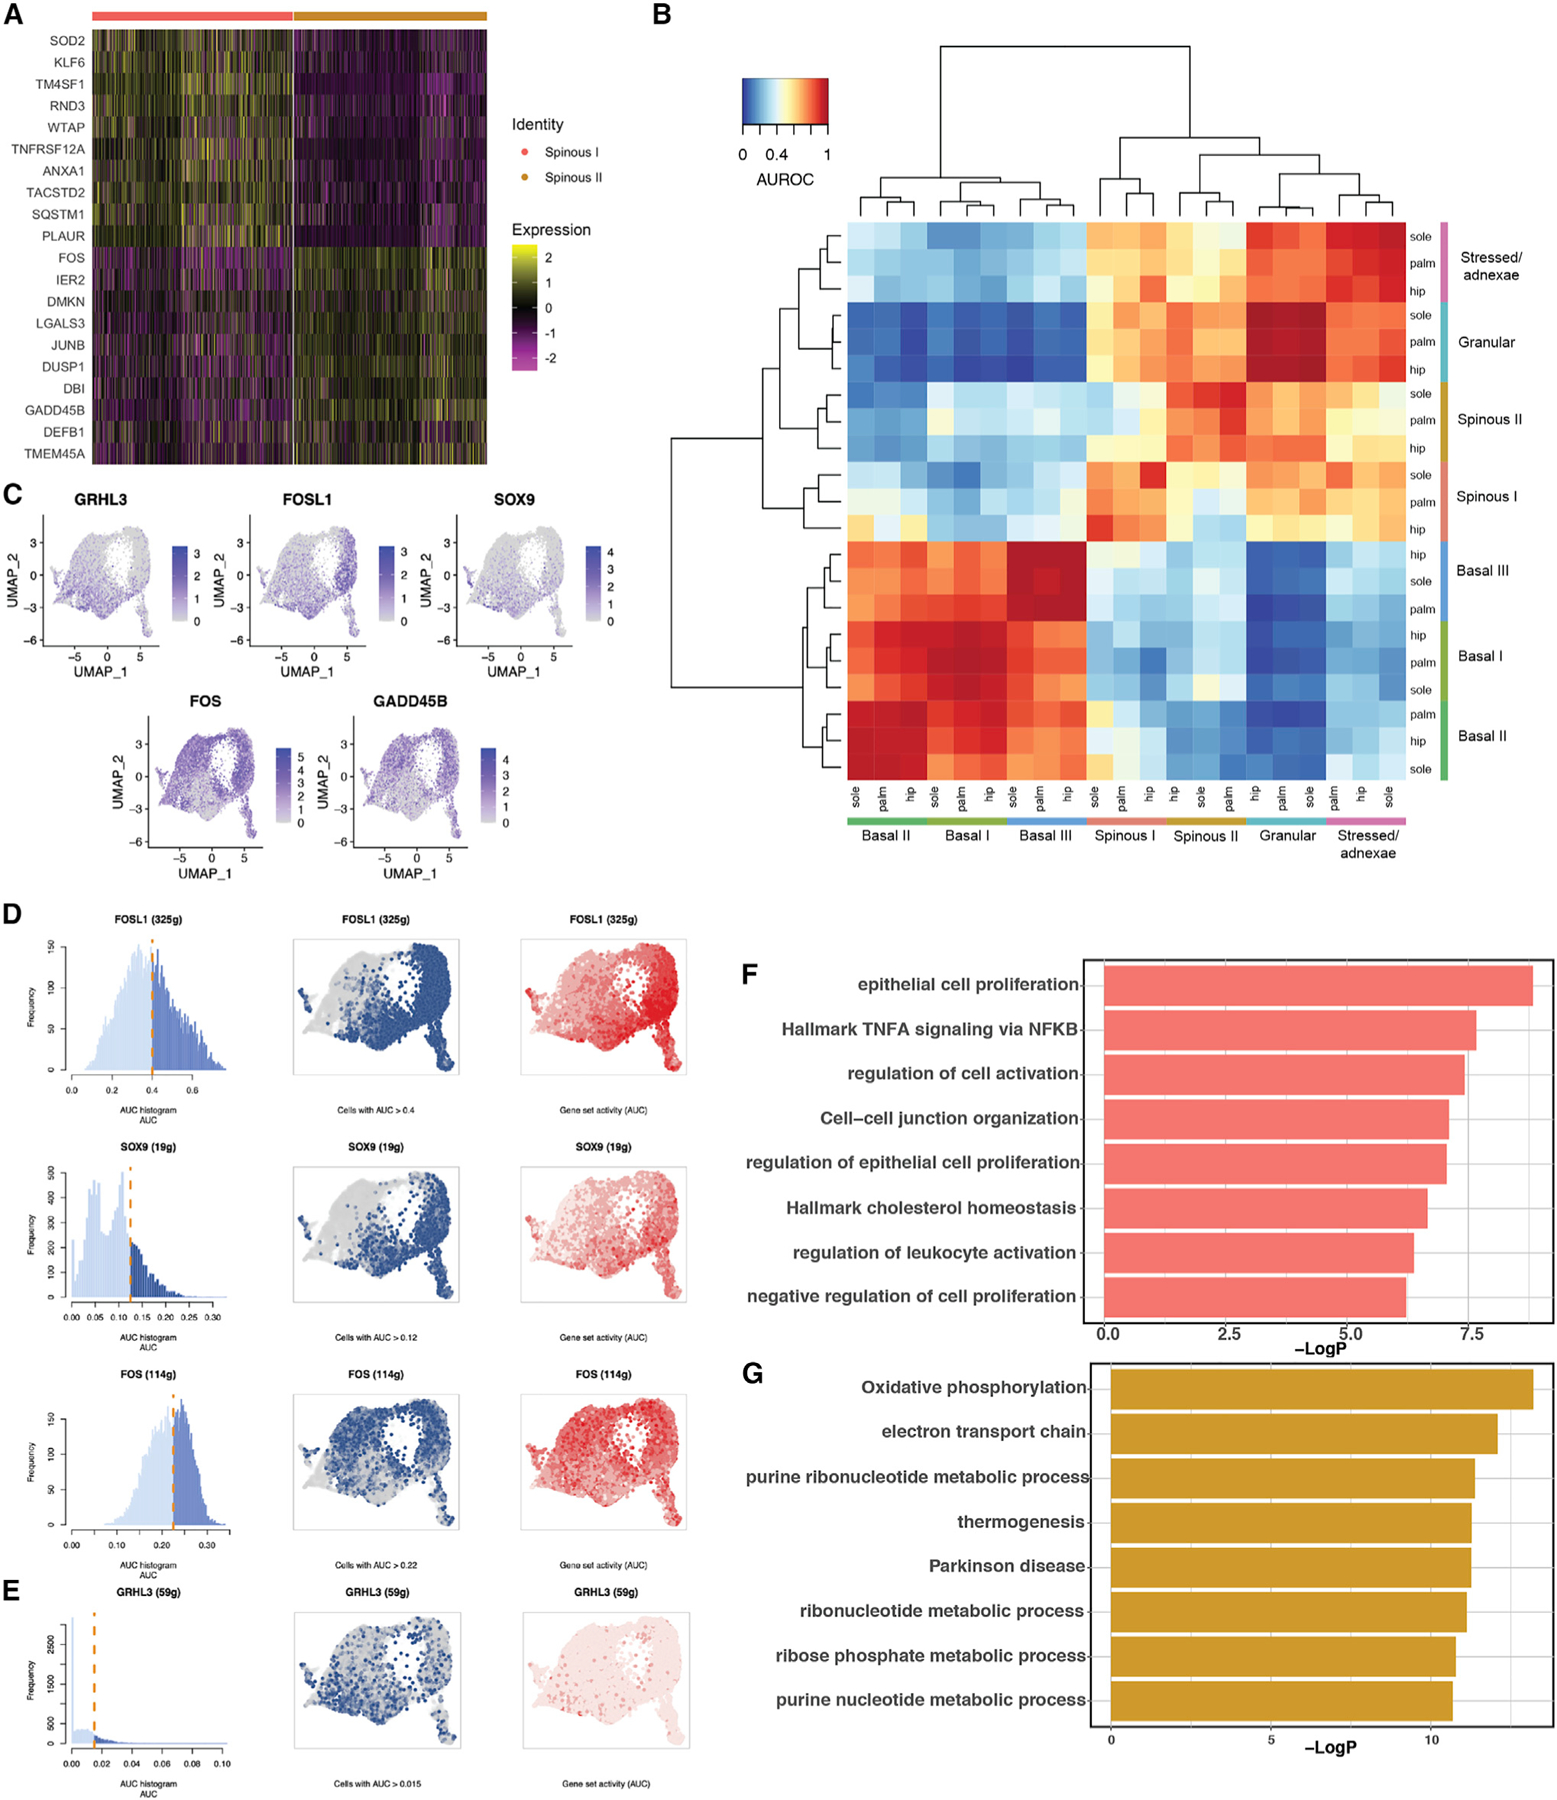
Figure 6. Adult epidermis contains two distinct spinous populations.

(A) Heatmap of top differentially expressed genes between spinous I and spinous II.
(B) Heatmap of AUROC scores between keratinocyte clusters based on the highly variable gene set using MetaNeighbor.
(C) Feature plot showing the most distinct markers for spinous I and II populations.
(D) SCENIC result, with cutoff for AUC score for each transcription factor network (left), UMAP with cells above the given AUC score threshold colored blue (middle), and UMAP with cells colored by the AUC score in red (right).
(E) AUCell scoring of GRHL3 network based on Klein et al.46 Panels as in (D).
(F) Bar plot showing specific enrichment of GO terms for spinous I.
(G) Bar plot showing specific enrichment of GO terms for spinous II.
