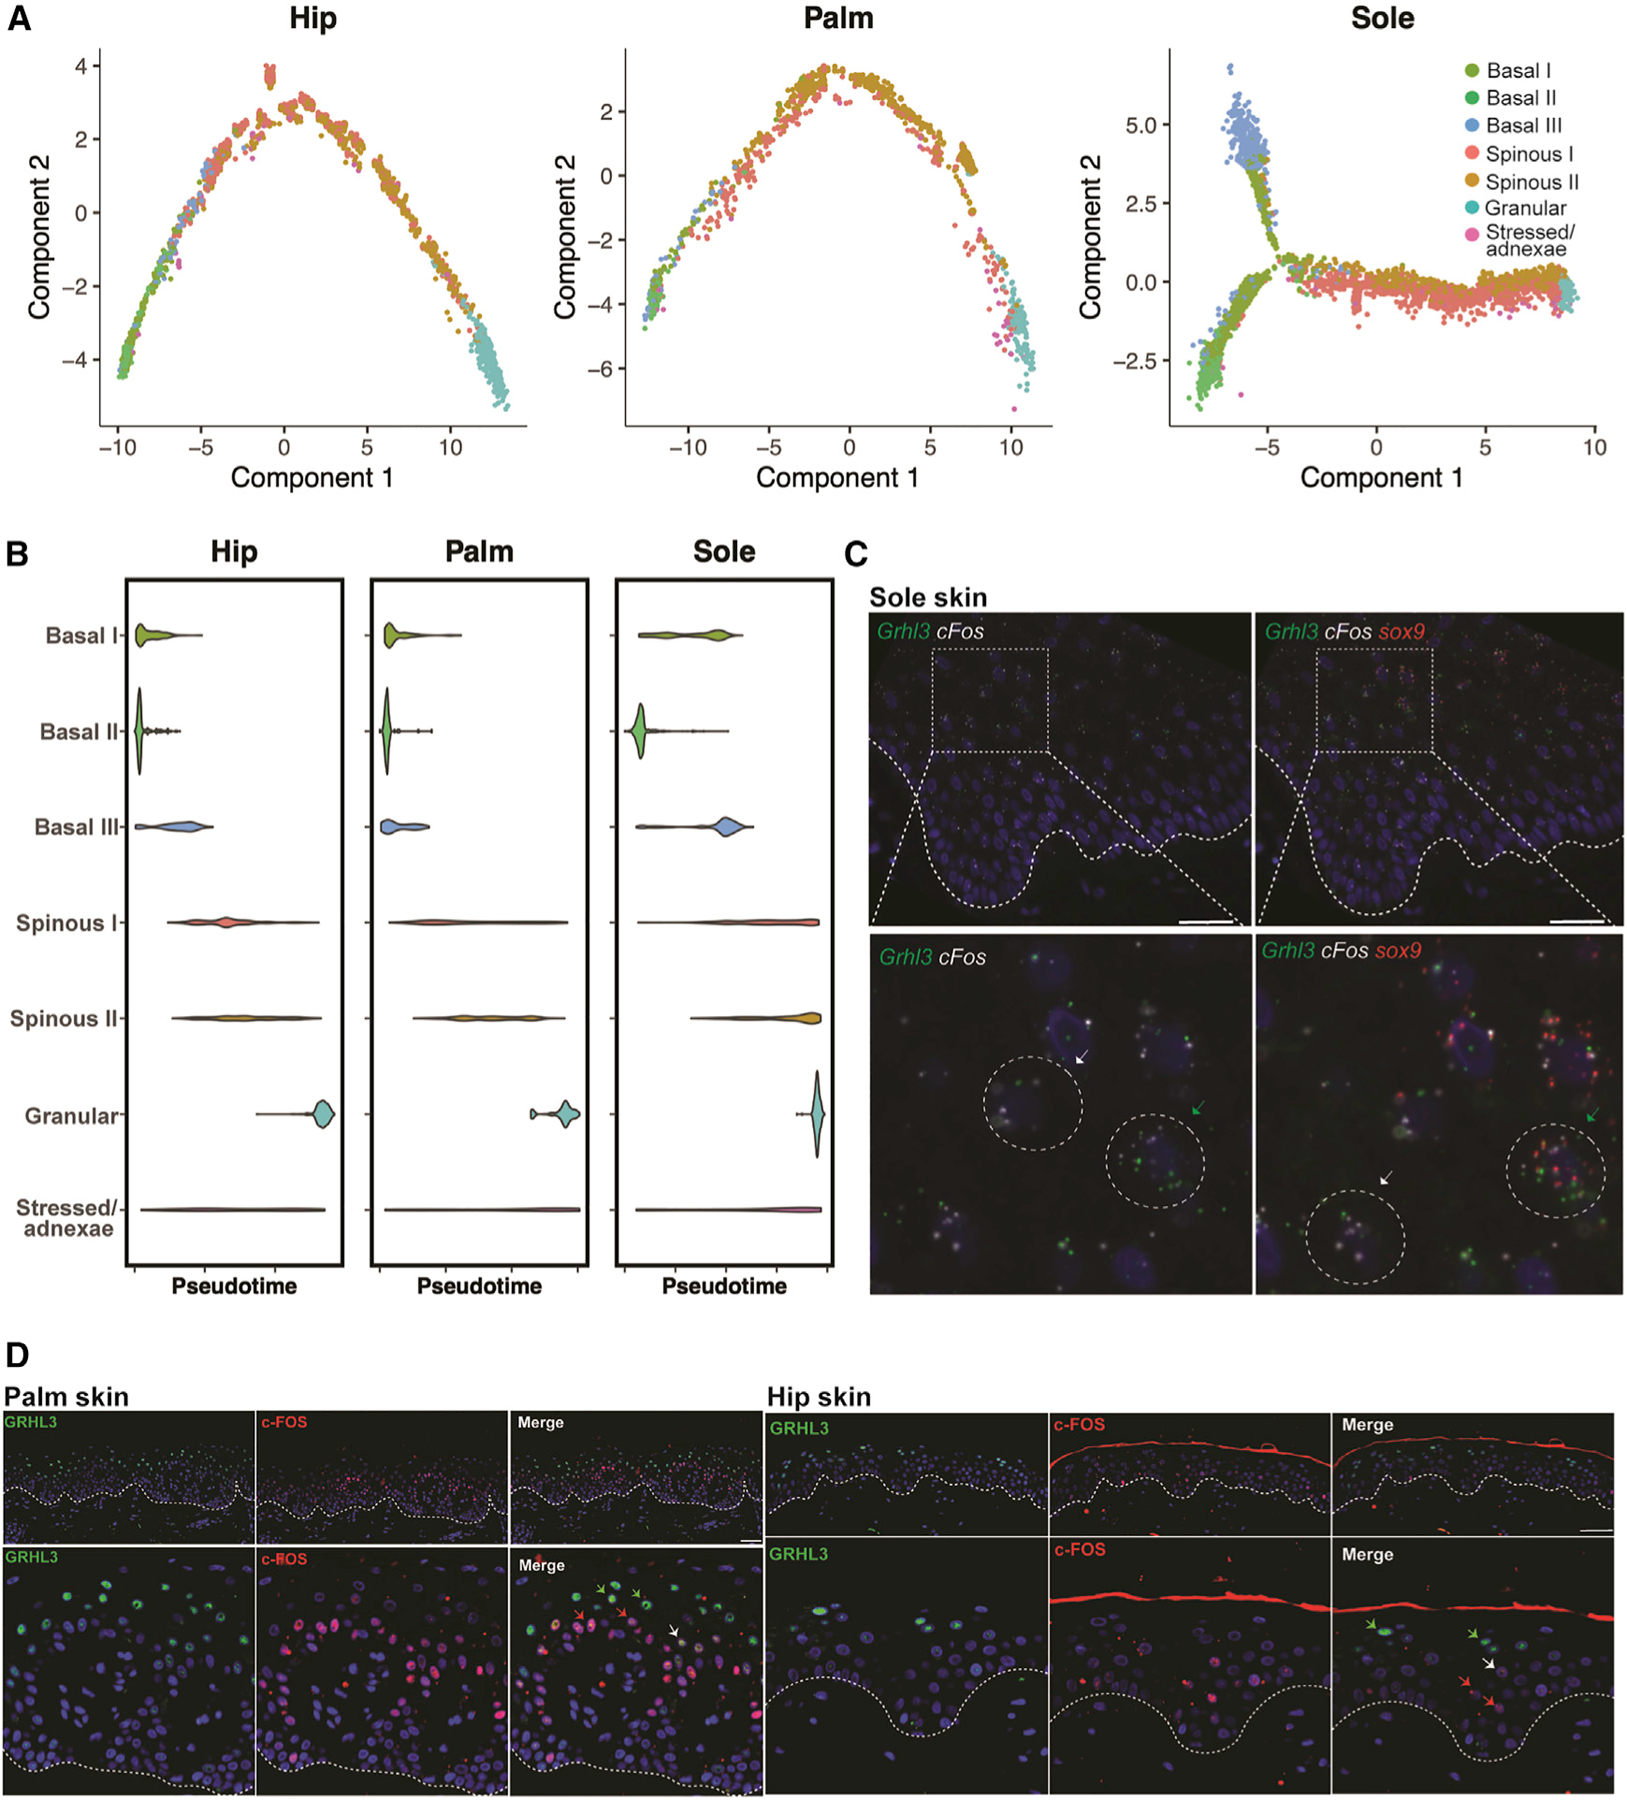
Figure 7. Spinous populations represent two differentiation trajectories with a shared end state.

(A) Monocle pseudotime trajectories showing epidermal differentiation for each site.
(B) Violin plots showing distribution of keratinocytes in each cluster over pseudotime for the three sites.
(C) Immunostaining of spinous cluster markers GRHL3 and c-FOS in the palm. White dotted line, dermal-epidermal junction. Scale bars: 80 μm.
(D) Validation of the presence of two distinct spinous populations by co-immunostaining of GRHL3 and c-FOS in hip and palm skin. White dotted line, dermalepidermal junction. Scale bars: 150 mm.
