. 2023 Feb 6;14:1100399. doi: 10.3389/fendo.2023.1100399
Copyright © 2023 Sun, Huang, Zhang, Ma, Chen, Zhao and Zhou
This is an open-access article distributed under the terms of the Creative Commons Attribution License (CC BY). The use, distribution or reproduction in other forums is permitted, provided the original author(s) and the copyright owner(s) are credited and that the original publication in this journal is cited, in accordance with accepted academic practice. No use, distribution or reproduction is permitted which does not comply with these terms.
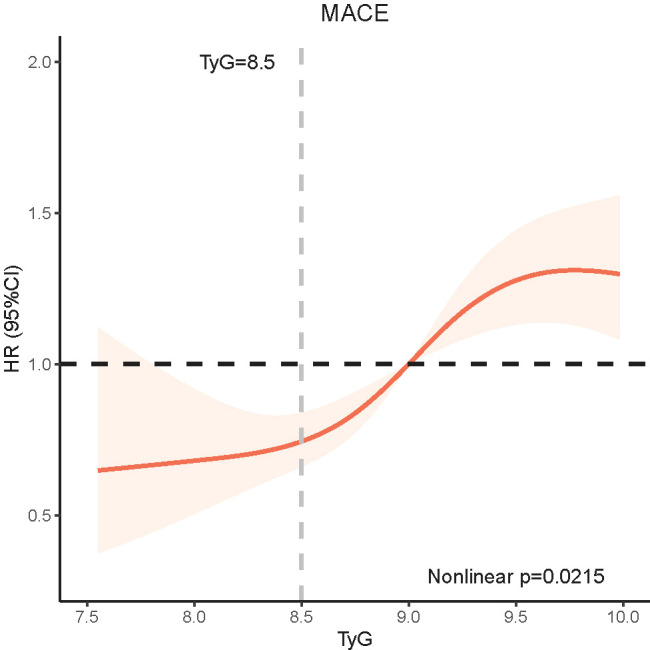
Figure 3.

RCS model showing the association between the TyG quartiles and MACE.
