FIGURE 1.
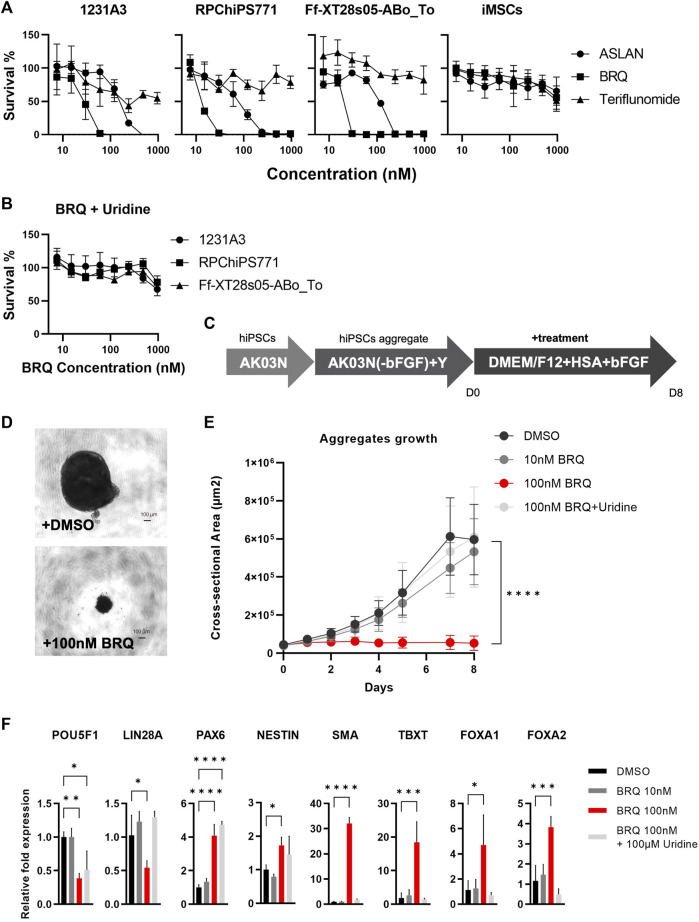
Vulnerability of hiPSCs to DHODH inhibition (A) Survival measurement using water-soluble formazan dye after the treatment with DHODH inhibitors, Teriflunomide (Triangle), ASLAN (Circle), and Brequinar (Square) for 7 days on 1231A3, RPChiPS771, Ff-XT28s05-ABo_To hiPSCs lines and iMSCs (From left to right). (B) Rescued survival of 1231A3 (Circle), RPChiPS771 (Square), and Ff-XT28s05-ABo_To (Triangle) BRQ-treated hiPSCs lines by 100 µM Uridine supplementation. Data plotted as mean with error bar S. D, minimum of triplicates per hiPSCs line and triplicates of three biological repeats of the iMSCs. (C) Schematic representation of iPS cell aggregates formation, hiPSCs were collected in single cell suspension then cultured in ultra-low attachment U-bottom 96-well plates in StemFit Basic03 in the presence of ROCK inhibitor (Y) for 2–3 days until aggregates with clear edges are formed. Medium then was replaced with DMEM/F-12 supplemented with 0.1% HSA and 10 ng bFGF and (D) phase contrast images were taken, then the (E) area of each aggregate was measured, dots represent mean and error bar is S. D, n = 6, biological replicates. (F) Relative mRNA expression of pluripotency markers (POU5F1 and LIN28), ectodermal markers (PAX6 and NESTIN), mesodermal markers (SMA and TBXT), and endodermal markers (FOXA1 and FOXA2), mRNA of minimum 4 aggregates were extracted per sample after 3 days of treatment then expression was detected by RT-qPCR, DMSO (Black), 10 nM BRQ (Dark gray), 100 nM BRQ (Red) and 100 nM BRQ with 100 µM Uridine (Light gray). Bar: mean, Error bar: S. D, n = 3, biological replicates.

