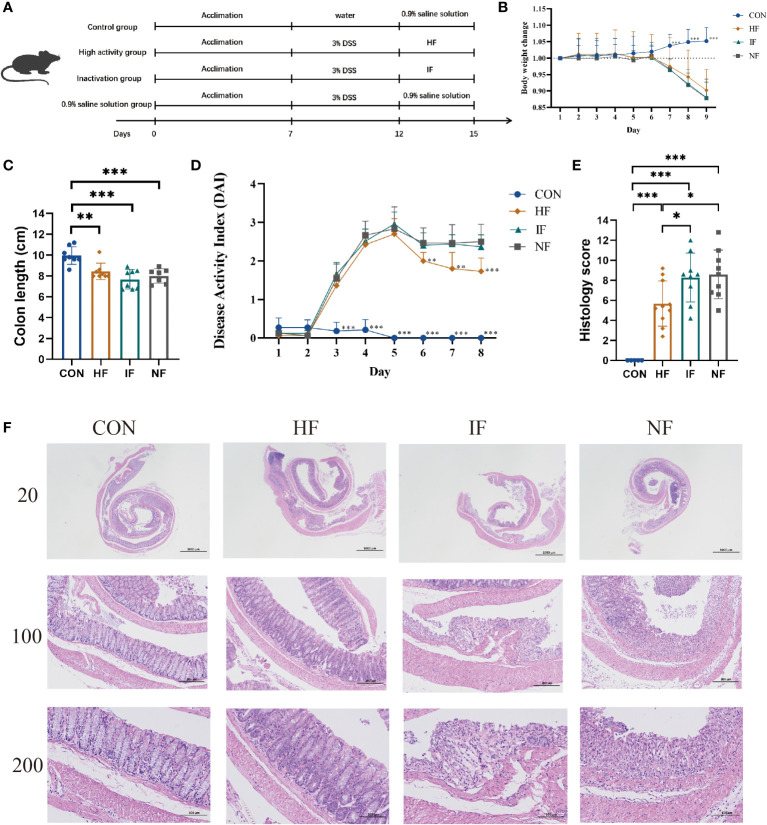
Figure 1.
(A) The animal experimental protocol. (B) Daily body weight changes throughout the entire duration of the study. (C) the lengths of colon from each group. (D) Kinetics of DAI scores throughout the entire duration of the study. (E) Histological scores of colons. (F) H&E stained colon sections. Data are presented as mean ± SD. ***p < 0.001, **p < 0.01 and *p < 0.05 vs the NF group.

