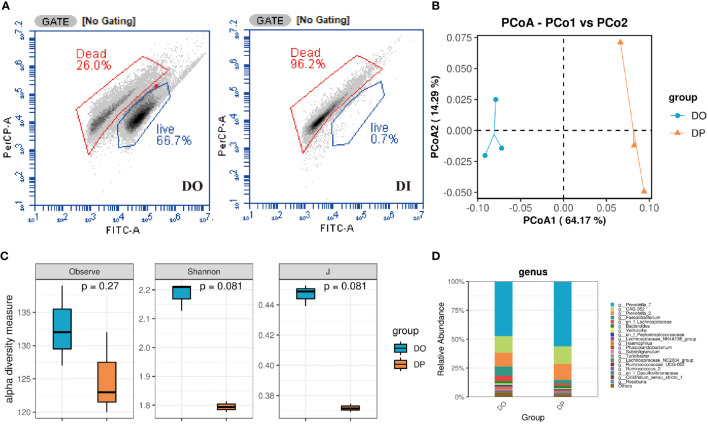
Figure 2.
Composition of donor gut microbiota before and after PMA treatment turned out. (A) Flow cytometry counts of DO and DI groups. DO, DI and DP samples were analyzed based on 16S rRNA gene sequencing. (B) PCoA analysis; (C) Taxonomic profiles at the top 20 genus levels in terms of overall mean relative abundance; (D) microbial alpha diversity as estimated by species richness, the Shannon diversity index, and the Inverse Simpson diversity index(J) based on OTU abundance data.

