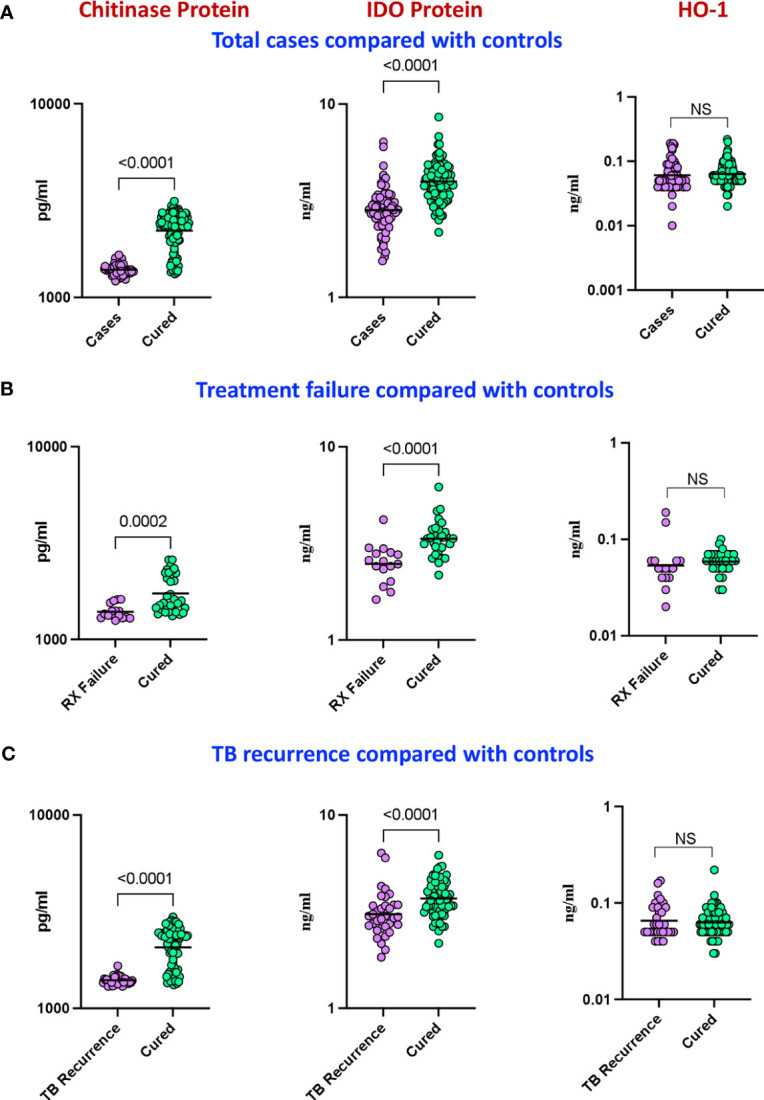
Figure 2.

Baseline analysis of plasma levels of chitinase protein and IDO protein in cases. The baseline plasma levels of chitinase protein, IDO protein and HO-1 were measured in (A) cases (n=68) and controls (n=108) (B) TB treatment failure (n=16) and controls (n=35) and (C) TB recurrence (n=34) and controls (n=69). The data are represented as scatter plots with each circle representing a single individual. P values were calculated using the Mann-Whitney U test with Holm’s correction for multiple comparisons. NS : No significance.
