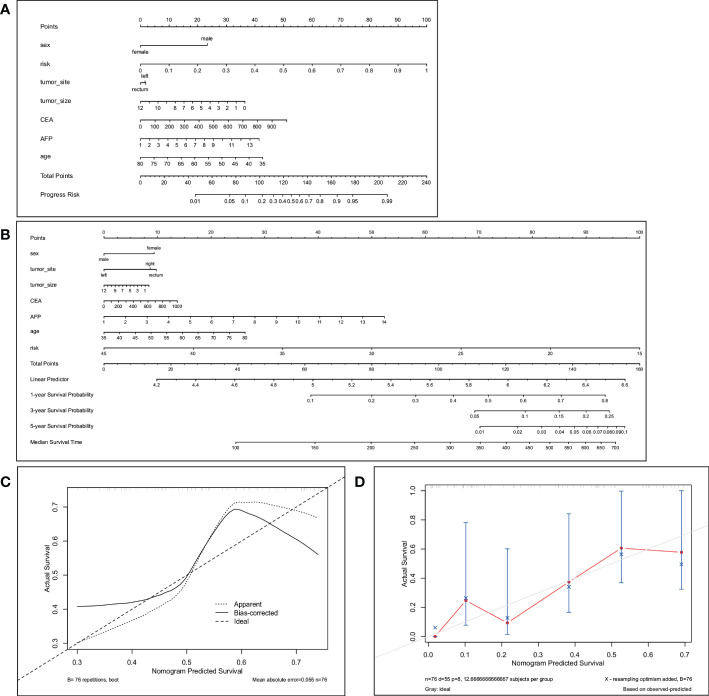
Figure 4.
The nomogram (A) predicts the best response in patients with CRLM. The total score is calculated by summing the points for each factor. The total score corresponds to the patient’s best response prediction. (C) is the calibration curve corresponding to the nomogram. The nomogram (B) predicts 1-year, 3-year and 5-year PFS in patients with CRLM. Total points are calculated by summing the points for each factor. The total score corresponds to the 1-, 3-, and 5-year PFS probabilities of the patients. (D) Calibration plots to predict 1-year progression-free survival (PFS).

