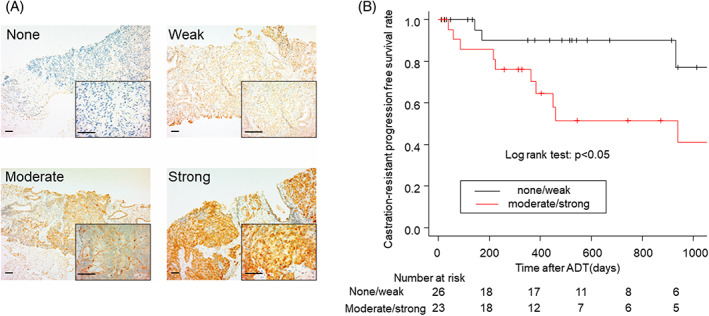
FIGURE 4.

IL13Rα2 expression levels in prostate cancer biopsy samples and their association with time to castration‐resistance. A. IL13Rα2 expression levels (none, weak, moderate, and strong) in prostate cancer tissues obtained at diagnosis of prostate cancer before patients had undergone any treatment (with 40X and 400X magnification, Scale bars: 100 μm). B. Kaplan–Meier curves of castration‐resistant progression‐free survival of patients with none/weak (n = 26) and moderate/strong (n = 23) expression of IL13Rα2. p < 0.05 in log rank test
