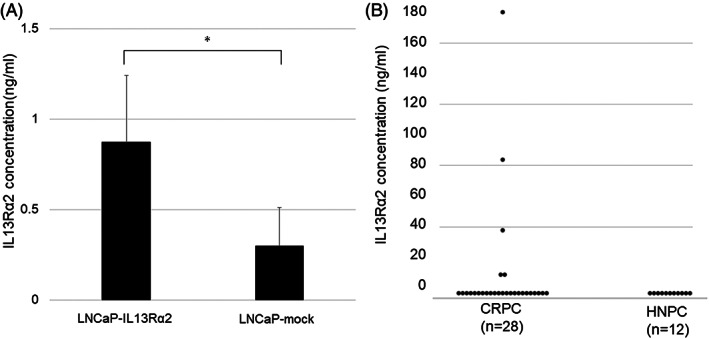
FIGURE 5.

IL13Rα2 concentration in supernatant of cell lines and serum samples of prostate cancer patients. A. IL13Rα2 concentrations measured by ELISA in the supernatant of LNCaP‐IL13Rα2 and LNCaP‐mock cells (*p < 0.05). B. IL13Rα2 concentrations in serum samples obtained from patients with CRPC (n = 28) and HNPC (n = 12)
