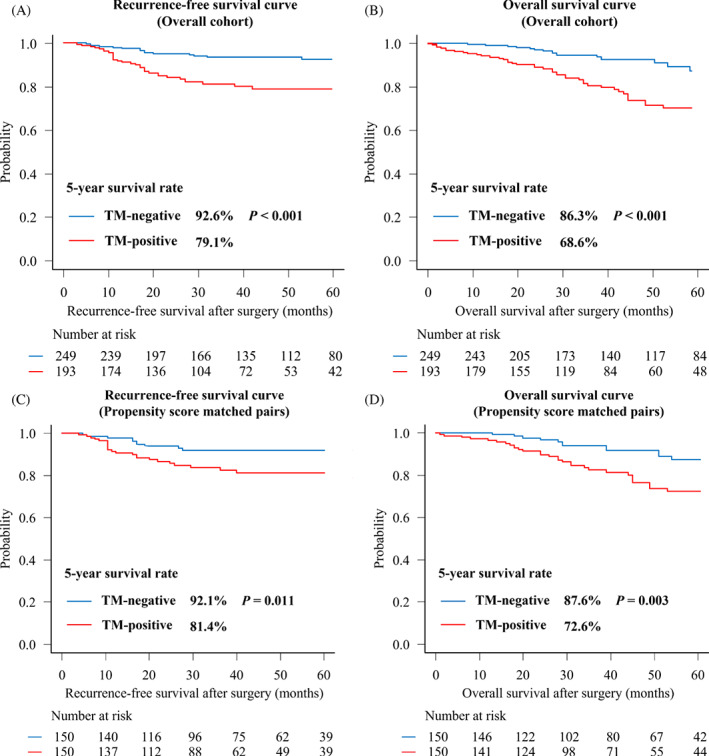
FIGURE 2.

Kaplan–Meier curves for stage I non‐small cell lung cancer according to preoperative tumor marker (TM) levels (TM‐negative; blue, TM‐positive; red). (A) Recurrence‐free survival (RFS) and (B) overall survival curves for overall patients, (C) RFS, and (D) OS curves after propensity score matching
