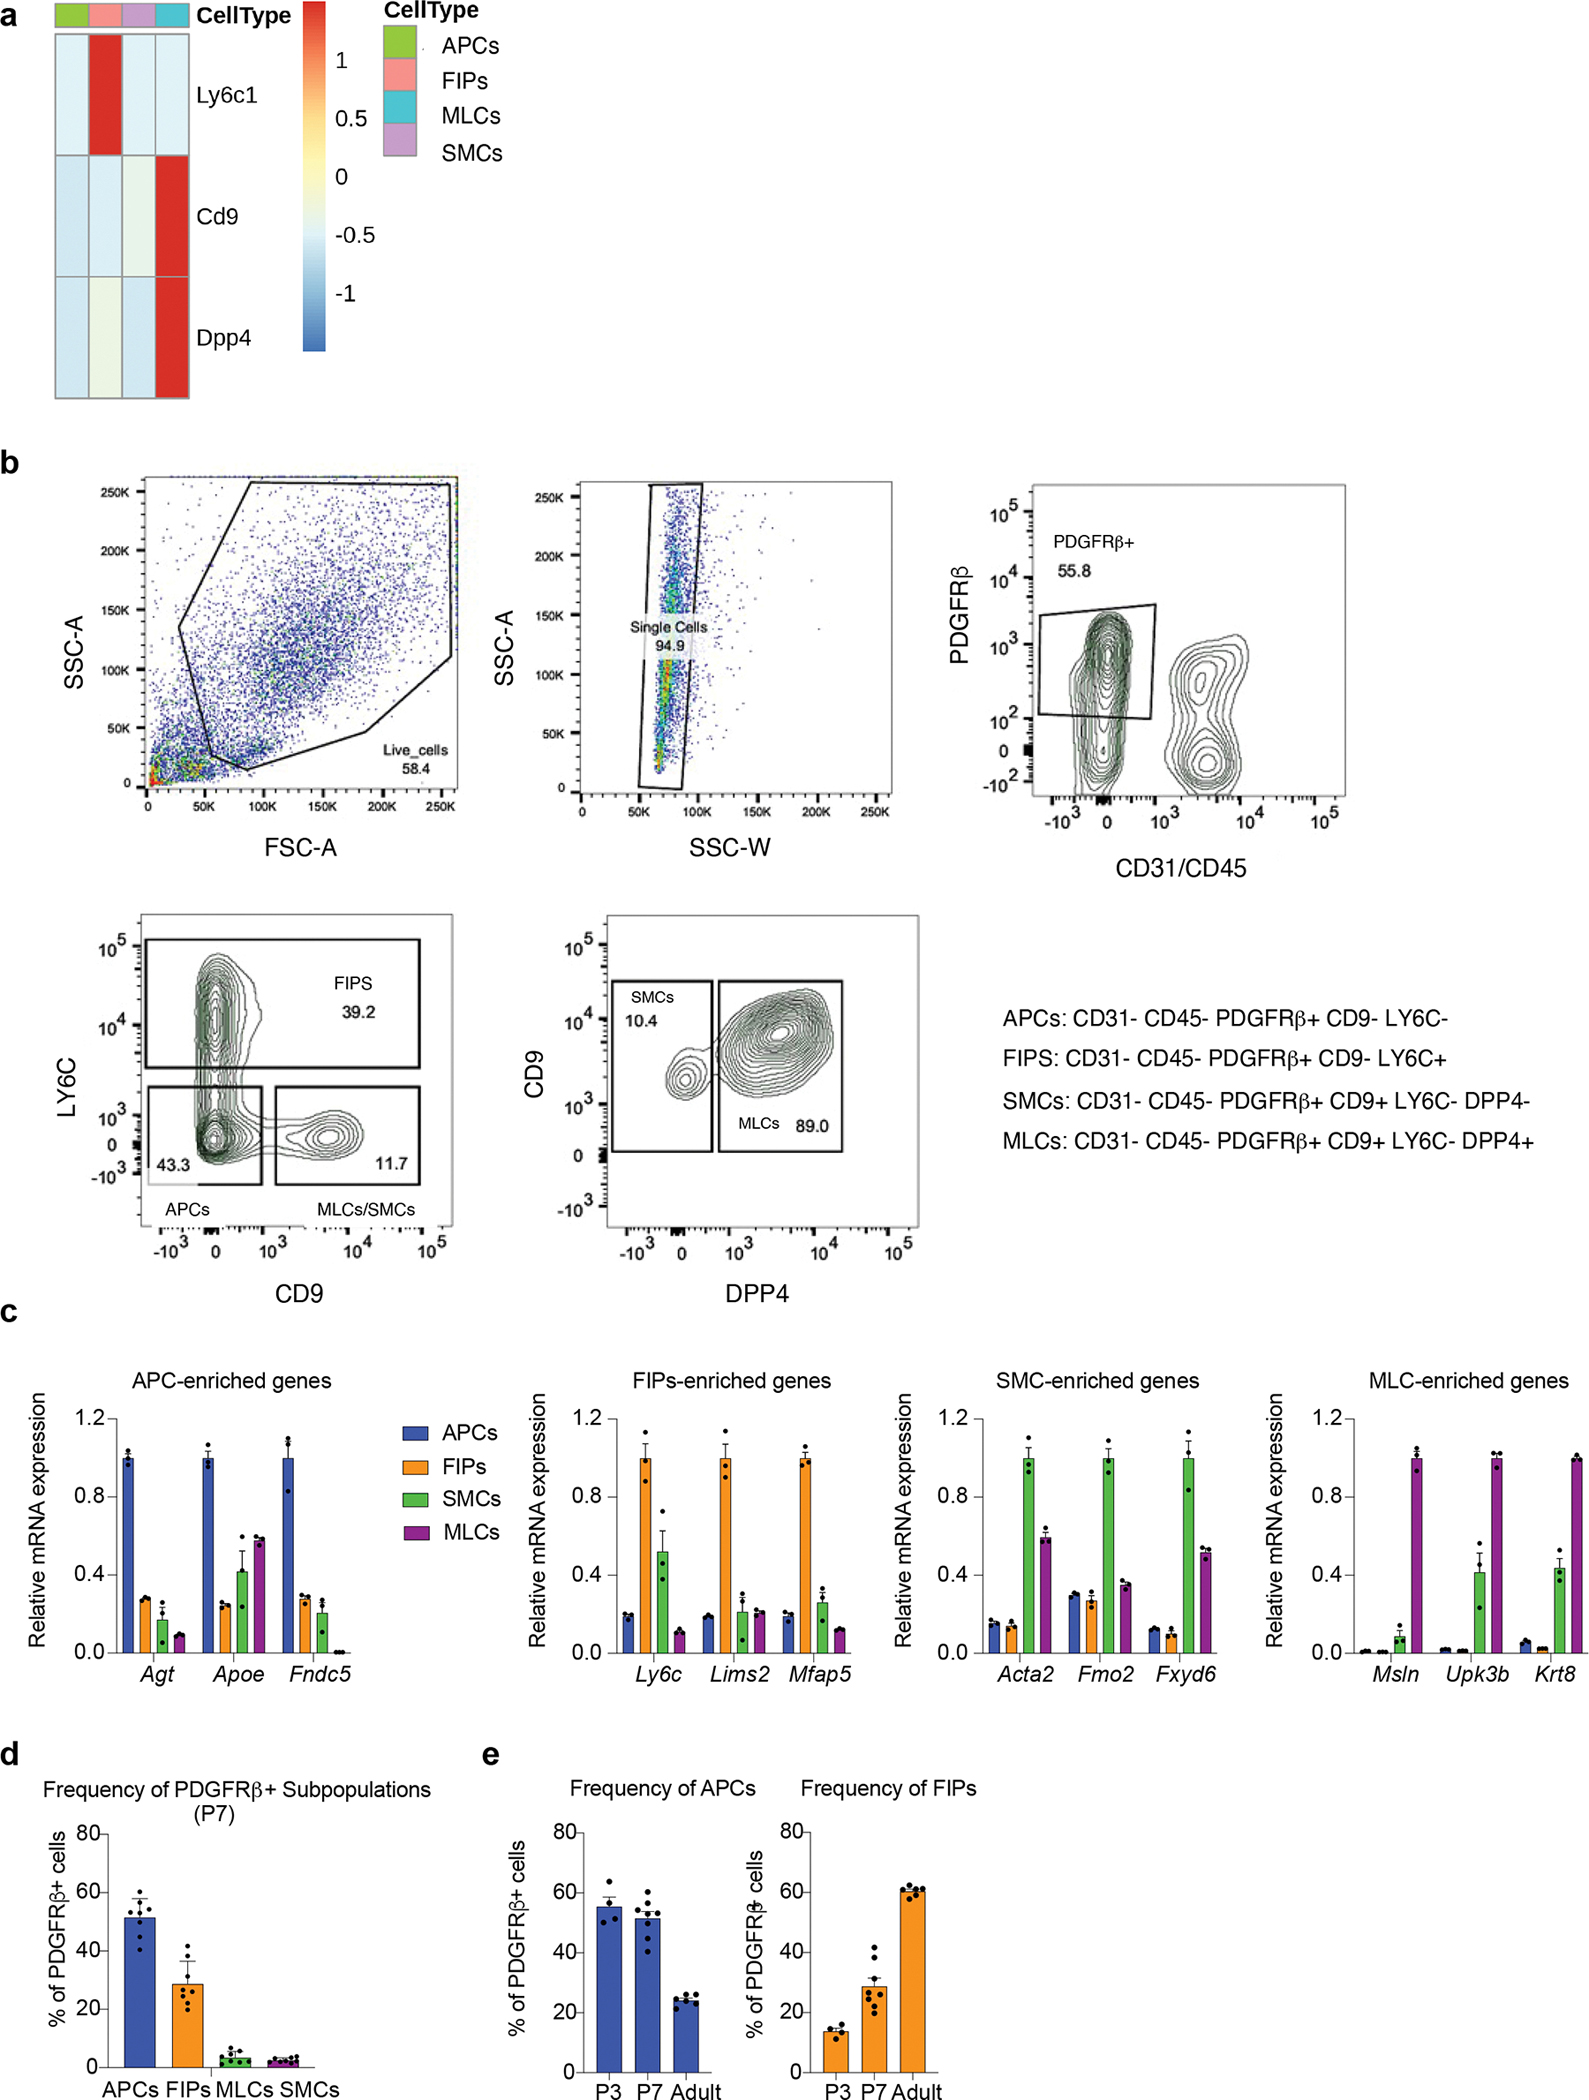
Extended Data Figure 4. FACS strategy for isolation of perinatal eWAT Pdgfrb+ sub-populations.

a) Expression of marker genes used for FACS in the single cell clusters.
b) Gating strategy for isolating P7 Pdgfrb+ sub-populations. After live cell and singlet selection, CD31−Cd45− (Lin−) PDGFRβ+ cells are selected. Pdgfrb+ sub-populations can then be separated based on LY6C, CD9, and DPP4, expression.
c) Validation of the sorting strategy: qPCR analysis of the expression of genes identified by scRNA-seq as markers of P7 Pdgfrb+ sub-populations. n=3 for each group.
d) Bar graph depicting the relative frequency of individual PDGFRβ+ subpopulations amongst total eWAT PDGFRβ+ cells based on flow cytometry analysis. n=8 for each group.
e) Bar graph depicting the relative frequency of APCs and FIPs amongst total eWAT PDGFRβ+ cells based on flow cytometry analysis across each developmental stage (P3, P7, Adult). n=4–8 for each group.
