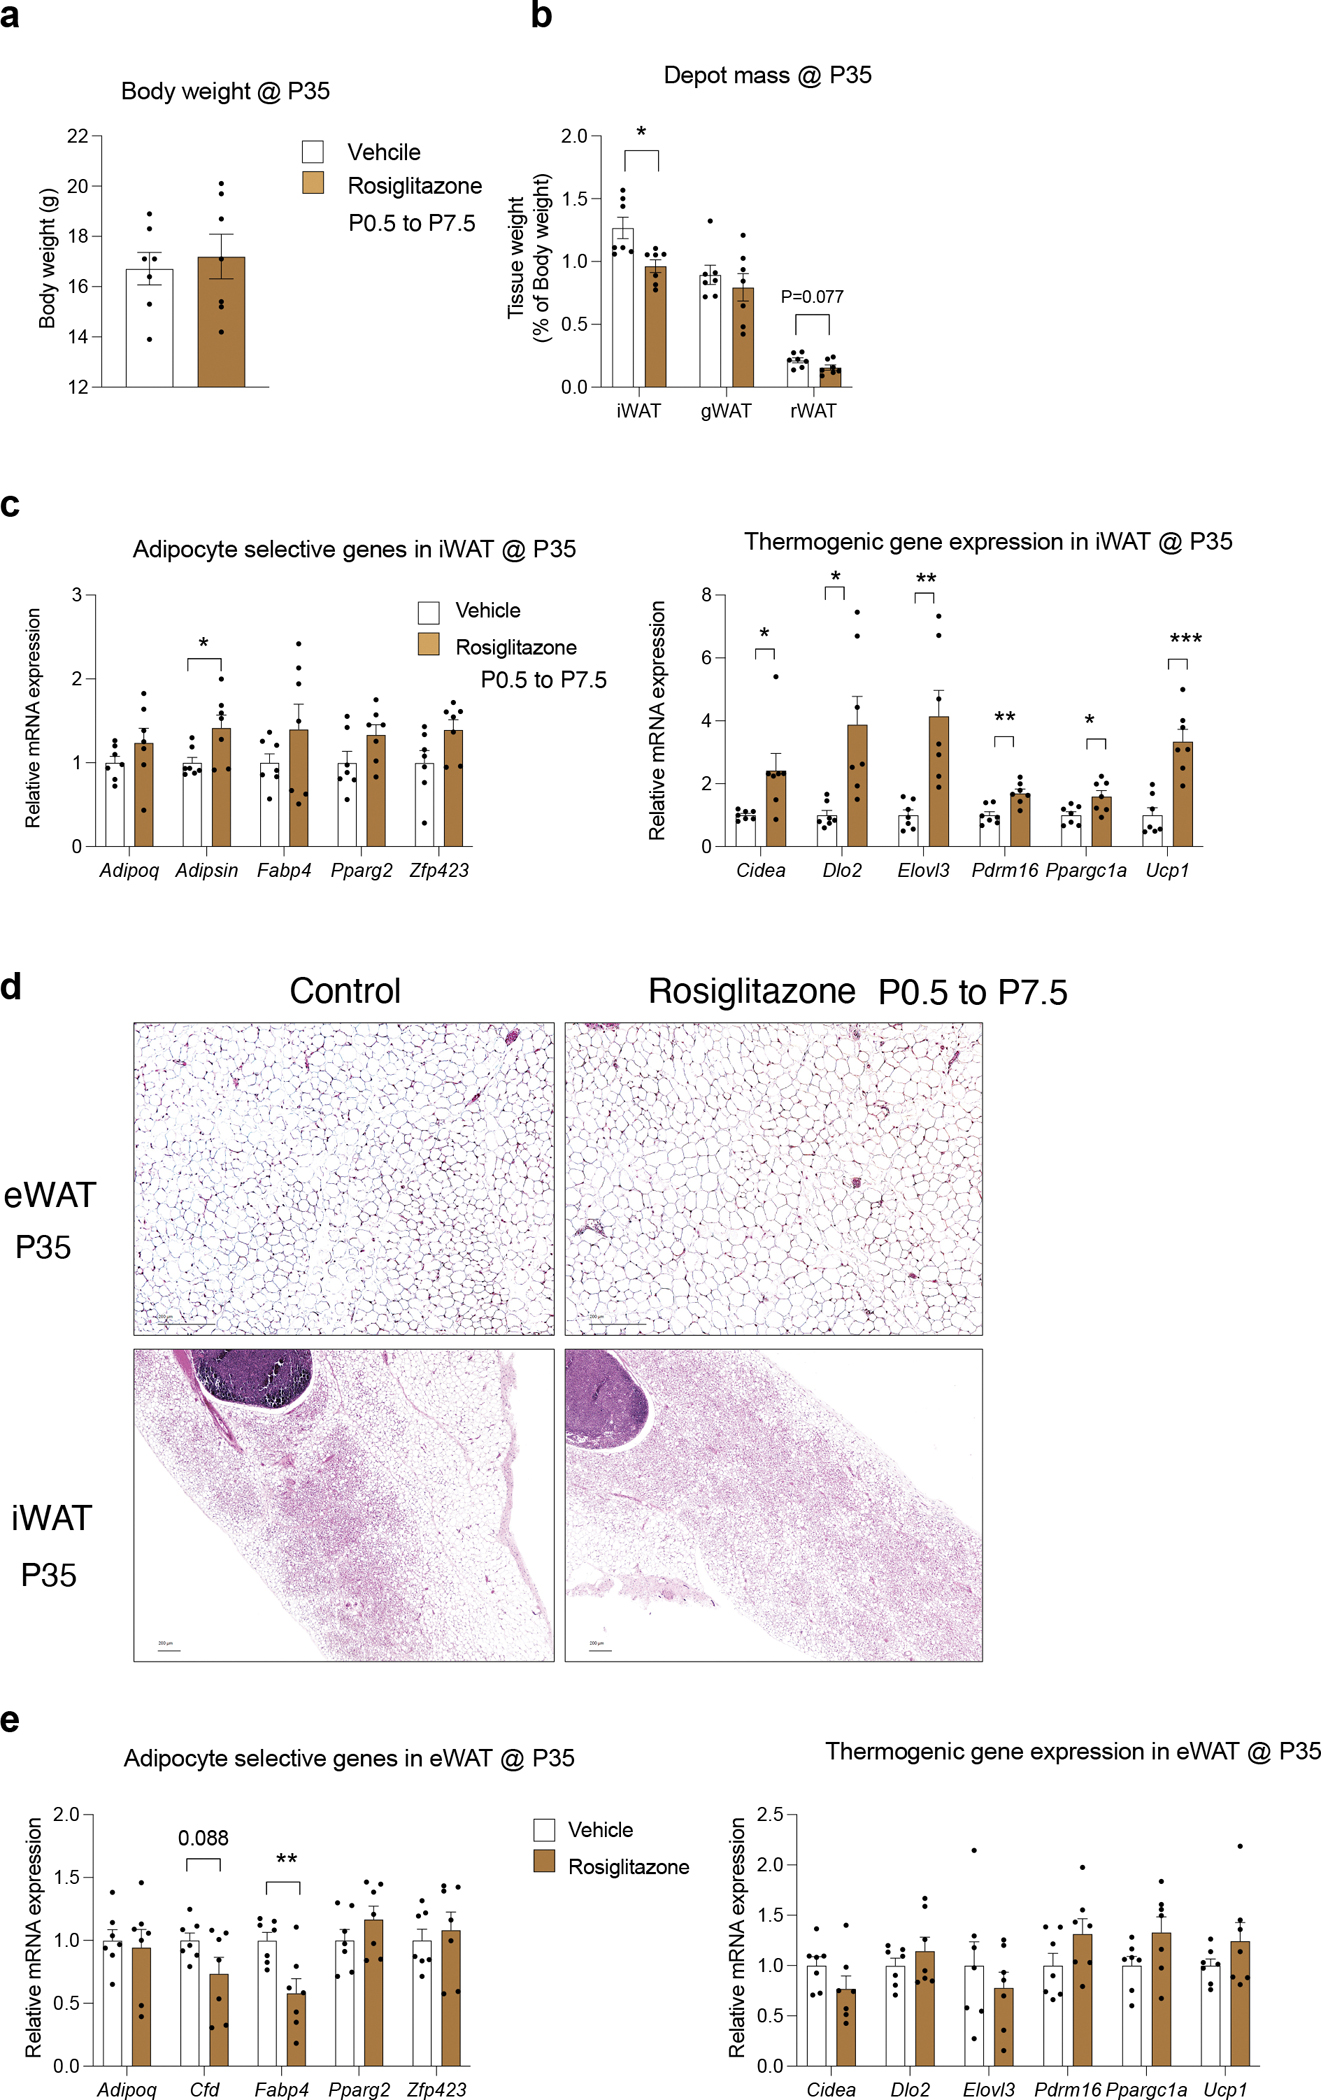
Extended Data Figure 8. Impact of transient perinatal Rosiglitazone treatment on adipose tissue in adulthood.

a) Transient perinatal Rosiglitazone treatment from P0.5-P7.5 was induced by exposing newborn pups to Rosiglitazone via lactating mothers oral gavaged with 10mg/kg Rosiglitazone solution daily for 7 days.
Body weights of Control and Rosiglitazone-treated mice at 5 weeks of age (P35). n=7 for each group. Bars represent ± SEM.
b) WAT depot mass of Control and Rosiglitazone treated mice at 5 weeks of age (P35). n=7 for each group. Bars represent ± SEM.
c) mRNA levels of indicated adipocyte-selective genes (right) and thermogenic genes (left) in iWAT from Control and Rosiglitazone treated mice at 5 weeks of age (P35). n=7 for each group. Bars represent ± SEM. * denotes p<0.05 by student t-test, ** denotes p<0.01, *** denotes p<0.001.
d) Representative 10x brightfield images of H&E stained eWAT and iWAT obtained from Control and Rosiglitazone treated mice at 5 weeks of age (P35).
e) mRNA levels of indicated adipocyte-selective genes (right) and thermogenic genes (left) in eWAT from Control and Rosiglitazone treated mice at 5 weeks of age (P35). n=7 for each group. Bars represent ± SEM.
Exact p values and numbers of repetitions can be found in Source Data Extended Data Figure 8.
