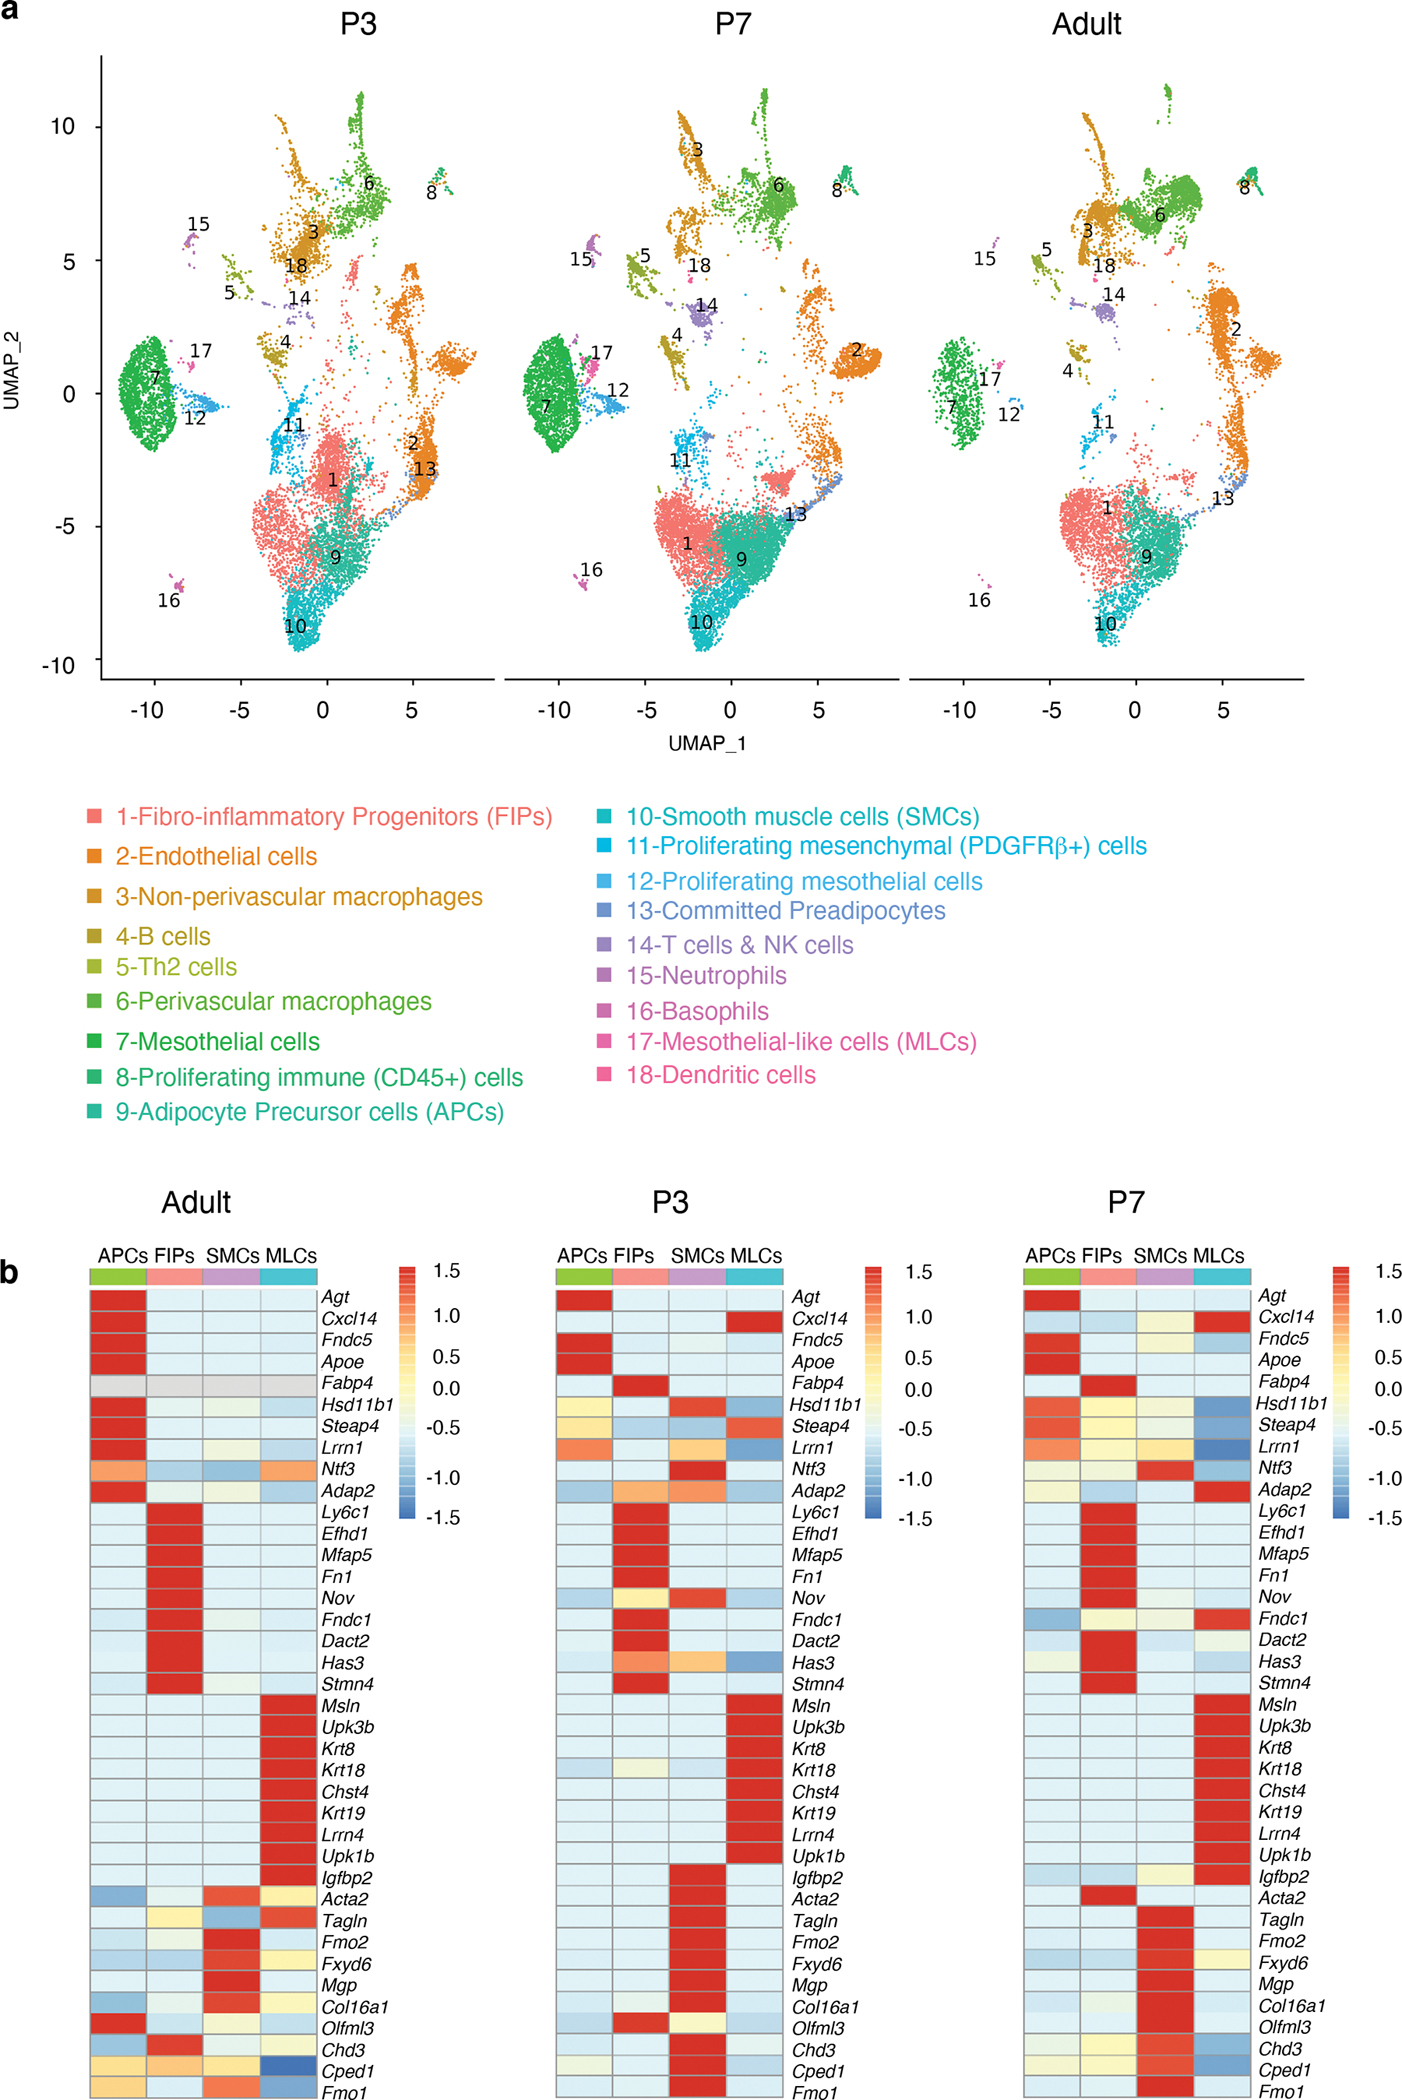
Figure 2. Cellular heterogeneity of perinatal and adult eWAT.

a) UMAP analyses of transcriptional profiles of eWAT stromal-vascular cells harvested at P3 (n= 11553 cells), P7 (n= 14538 cells) and 5-weeks of age (adult) (n= 10442 cells).
b) Heatmap depicting expression of 10 selected signature genes for PDGFRβ+ sub-populations: APCs (cluster 9), FIPs (cluster 1), MLCs (cluster 17) and SMCs (cluster 10). Scaled by cluster mean expression and normalized by z-score. A full list of signature genes can be found in Supplementary Table 2.
