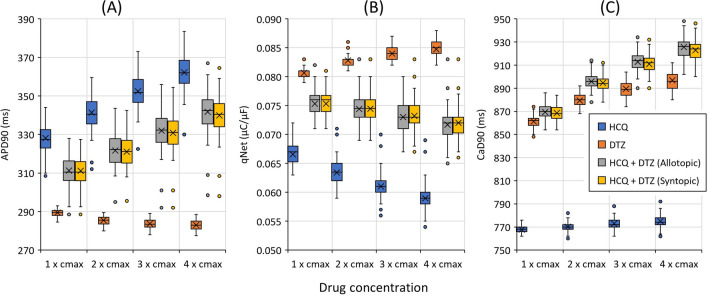
Figure 1.
Features (APD90, qNet, and CaD90) as a function of drug concentrations for hydroxychloroquine, diltiazem, and combined hydroxychloroquine-diltiazem. Panel (A) shows the result of APD90, panel (B) for qNet, and panel (C) for CaD90. The labels in axis represent the concentration of each compound incorporated in the simulation. For example, for the combination of compound A and B means that the concentration for each A and B is . Furthermore, in a single box plot, the cross line refers to the average value of the feature; the lower, middle, and upper lines of the box refer to the first quartile, median, and third quartile, respectively; the upper and lower lines outside the box refer to maximum and minimum values excluding the outliers; circles represent the outliers.

