Figure 3.

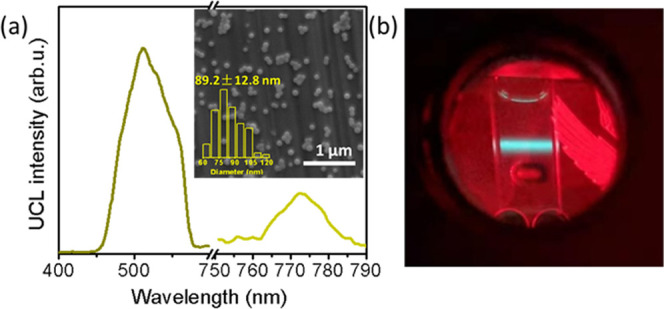
(a) Emission spectrum, SEM image (inset), and (b) photograph of VVUC2-CPNs aqueous suspension (λexc = 650 nm) obtained from CAEBD-S-COOH/Os-S-COOH = 120 (Table S2, entry 2). A short-pass filter (λcut-off = 650 nm) was used.

(a) Emission spectrum, SEM image (inset), and (b) photograph of VVUC2-CPNs aqueous suspension (λexc = 650 nm) obtained from CAEBD-S-COOH/Os-S-COOH = 120 (Table S2, entry 2). A short-pass filter (λcut-off = 650 nm) was used.