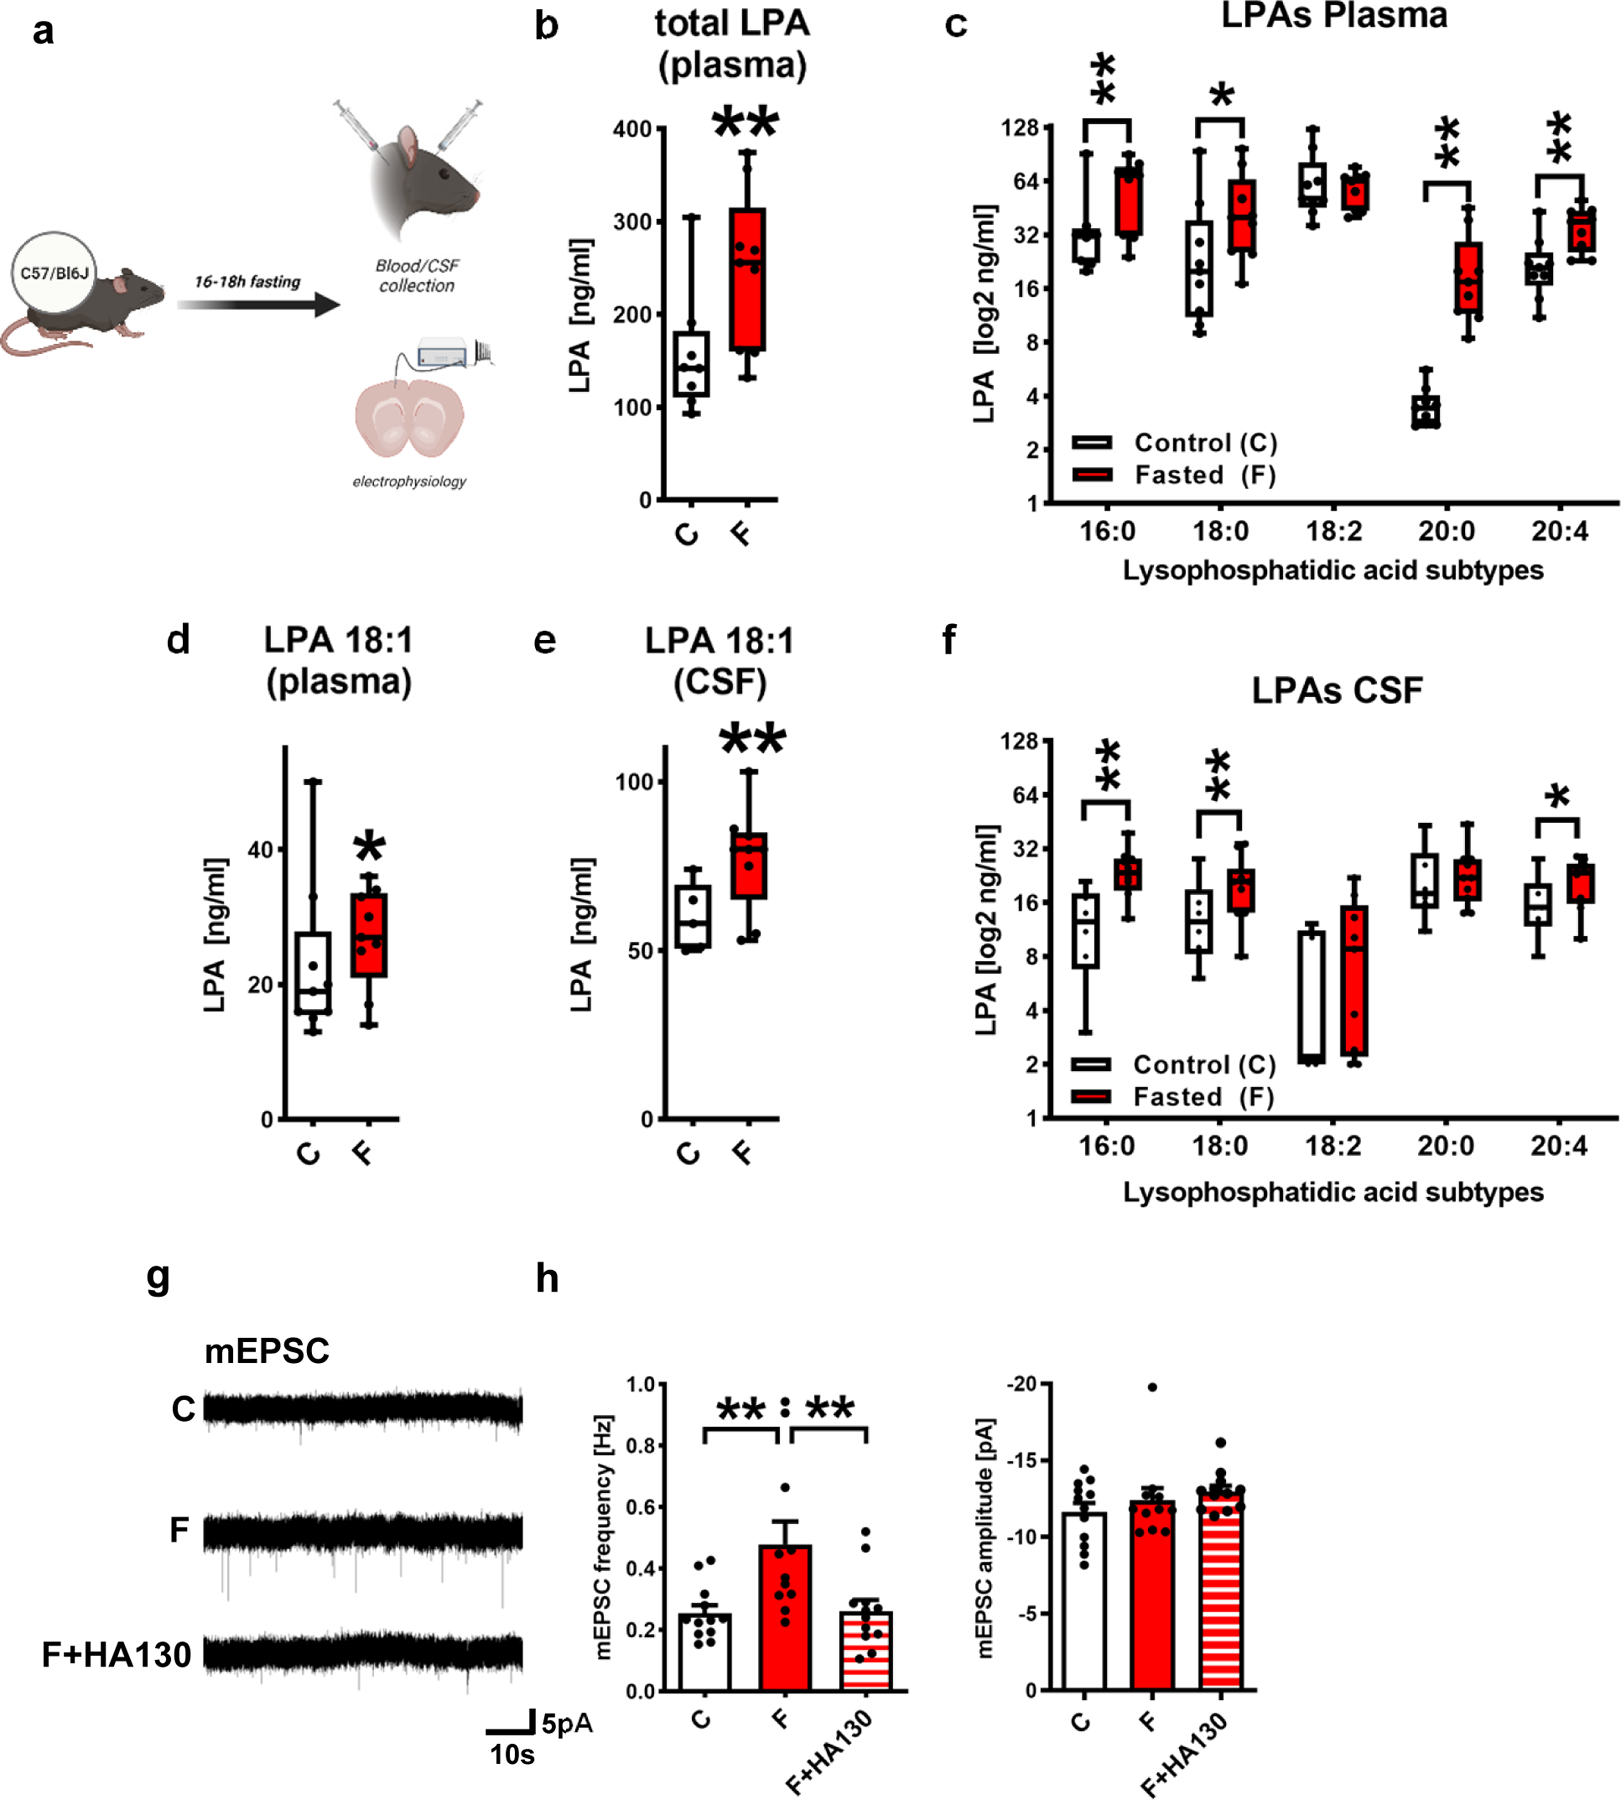
Figure 1. Fasting increases synaptic active LPA subtypes in the brain and enhances glutamatergic transmission.

a. Experimental design for blood plasma and CSF collection.
b. Total LPA blood plasma levels were increased in wild type (wt) animals after fasting (n= 8 control animals [C] and 10 fasted animals [F], group differences: 96.9%, Bayesian analysis).
c. LPA subtype analysis revealed increased blood plasma levels in wt fasted animals (n= 9 controls for LPA 18:0, 18:2, 20:0, 20:4 and 8 for LPA 16:0 and n = 9 fasted animals, group differences for LPA 16:0 97.1%, for LPA 18:0 89.9%, for LPA 18:2 60.9%, for LPA 20:0 99.7%, for LPA 20:4 99.1%, Bayesian analysis).
d. Blood plasma levels of LPA 18:1 were increased in fasted wt animals (n= 9 control animals and n = 9 fasted animals, group differences: 83.8%, Bayesian analysis).
e. Fasting resulted in increased CSF LPA 18:1 levels (n= 5 control animals and n = 9 fasted animals, group differences: 96.4%, Bayesian analysis).
f. In the CSF, fasting increased specific LPA levels (n= 6 controls for LPA 16:0, 18:0, 20:0, 20:4 and 5 for 18:2 and n = 10 fasted animals for LPA 16:0, 18:0, 20:0, 20:4 and 9 for LPA 18:2, group differences for LPA 16:0 98.7%, for LPA 18:0 90.3%, for LPA 18:2 76.9%, for LPA 20:0 60.0%, for LPA 20:4 89.2%, Bayesian analysis).
g. Original miniature excitatory postsynaptic currents (mEPSC) traces illustrating presynaptic release probabilities under control conditions, after fasting (F) and after application of the ATX-inhibitor HA130 after fasting (F + HA130).
h. mEPSC frequencies were significantly increased after fasting (F, P=0.0058) and were reduced to control values (C) when ATX was inhibited by HA-130 (F+HA130, P=0.0077) (n = 12 for C, n = 11 for F, n = 12 for F+HA130, one-way ANOVA with Bonferroni correction (frequencies, left) or Kruskal-Wallis test (amplitudes, right)). Bars represent mean and SEM.
Box plots and whiskers show data from min to max, line shows median. Points represent individual values. **p<0.01 or group differences of * >80% or **>90% for Bayesian analysis. Illustration was created with BioRender.
