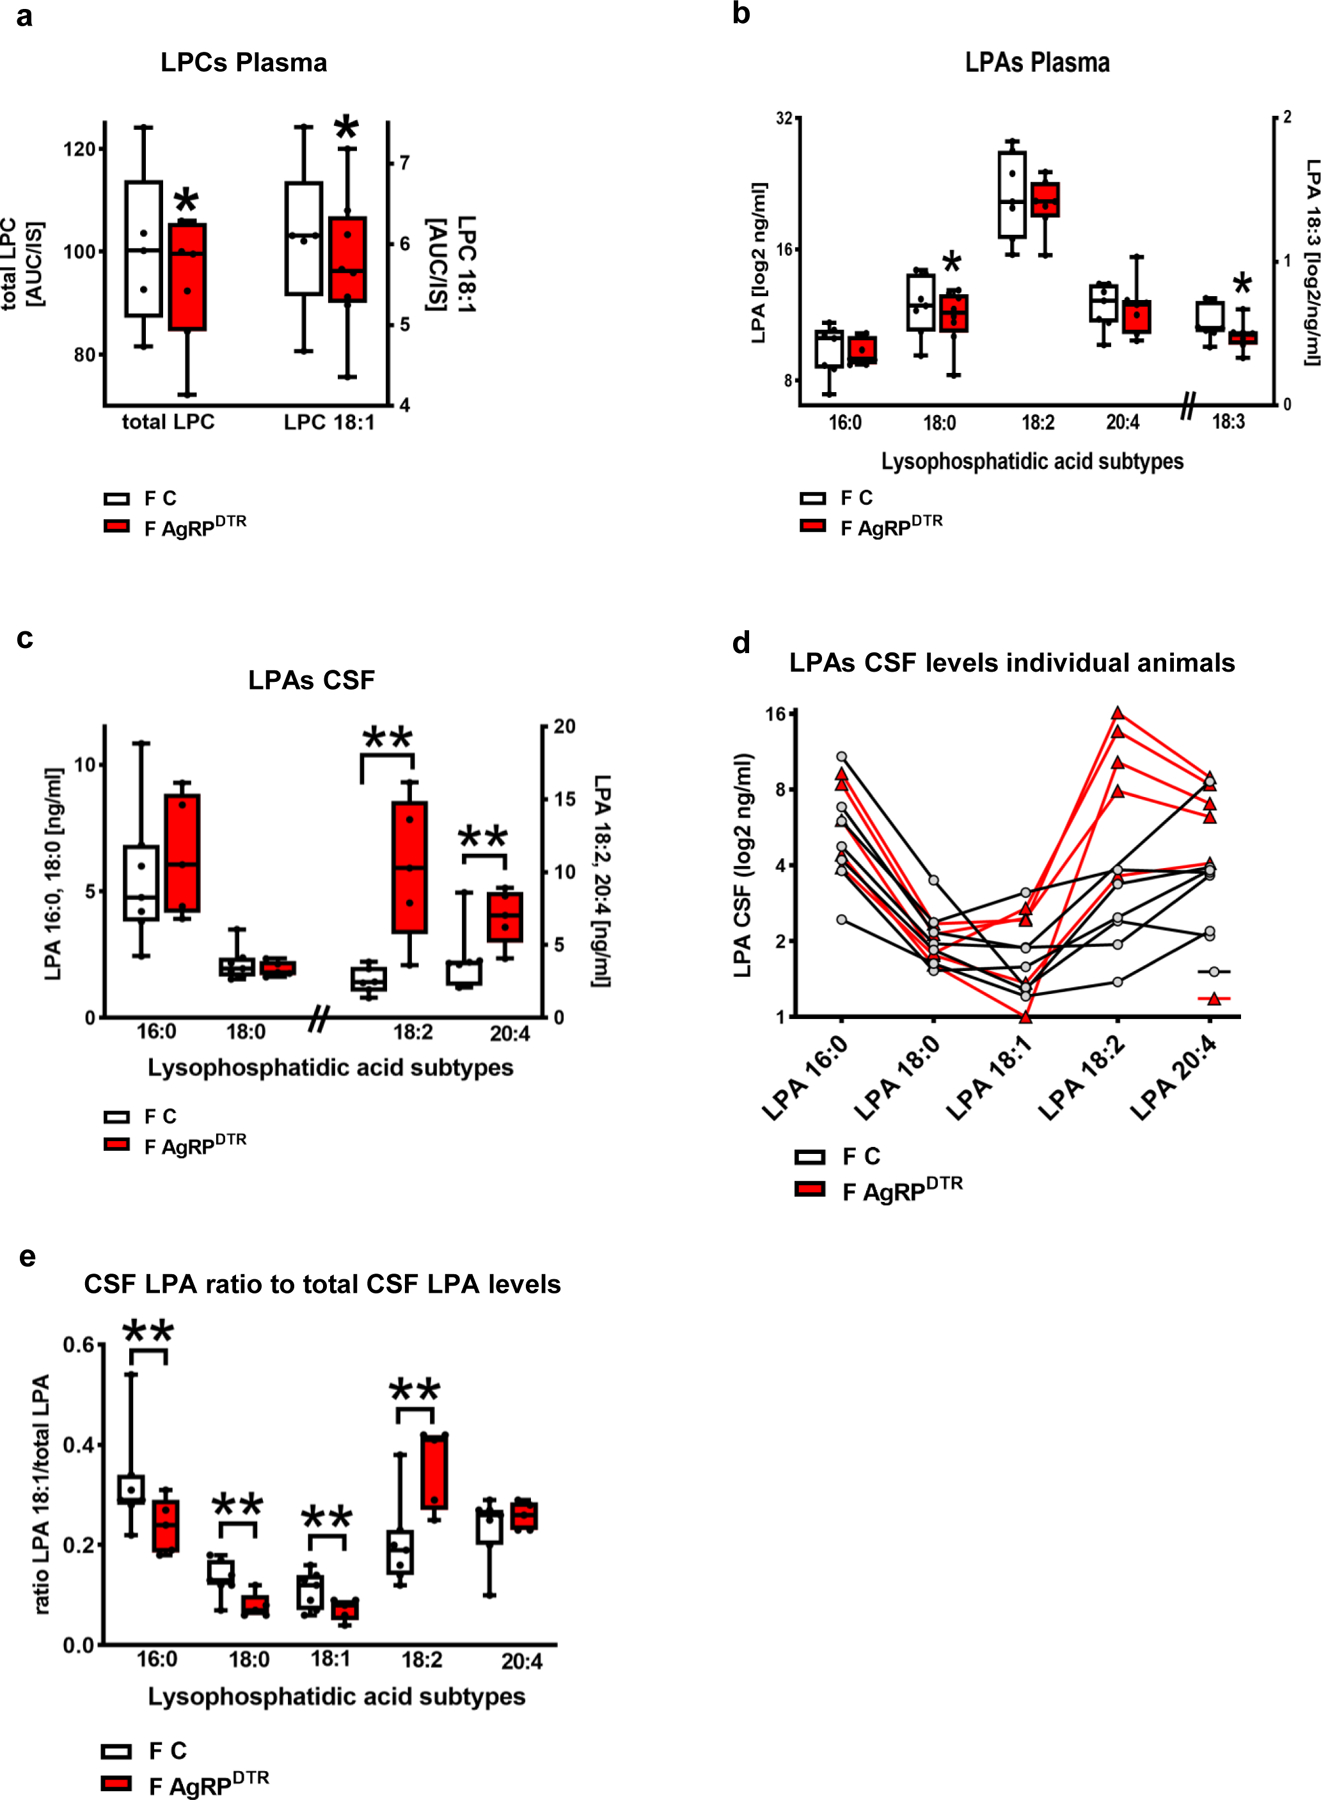
Extended Data Fig. 6. LPC and LPA levels in blood plasma and LPA concentrations in the CSF of AgRPDTR and control animals.

a. Blood plasma concentrations of total LPCs and 18:0 LPC revealed decreased concentrations in fasted AgRPDTR animals when compared to fasted control animals (n = 5 for fasted WT and n = 7 for fasted AgRPDTR mice, group differences for total LPC concentrations: 88.0%, for LPC 18:1 86,8%, Bayesian analysis).
b. Blood plasma levels of different LPA subtypes in fasted control and fasted AgRPDTR animals (n= 6 for LPA 16:0, 18:0,18:1 and n = 7 for 18:2, 18:3 and 20:4 for fasted control animals; n = 8 for LPA 18:0 and 7 for all other LPA subtypes for fasted AgRPDTR animals, group differences for LPA 16:0 79.7%, for LPA 18:0 84.4%, for LPA 18:2 68.4%, for LPA 18:3 85.7%, for LPA 20:4 55.1%, Bayesian analysis).
c. CSF levels of the different LPA subtypes in fasted control [F C] and fasted AgRPDTR [F AgRPDTR] mice (n = 6 for LPA 18:2 and 7 for all other LPAs in fasted controls and n = 5 for fasted AgRPDTR mice, group differences for LPA 16:0 68.8%, for LPA 18:0 69.4%, for LPA 18:2 97.3%, for LPA 20:4 95.5%, Bayesian analysis).
d. Individual CSF LPA levels displayed for the corresponding animals show high variance (n = 6 for LPA 18:2 and 7 for all other LPAs in fasted controls and n = 5 for fasted AgRPDTR mice). .
e. Ratio calculated for the different LPA subtypes to the total LPA levels in the corresponding animals (n = 6 for LPA 18:2 and 7 for all other LPAs in fasted controls and n = 5 for fasted AgRPDTR mice, group differences for LPA 16:0 90.2%, for LPA 18:0 97.5%, for LPA 18:1 93.5%, for LPA 18:2 98.8%, for LPA 20:4 70.5%, Bayesian analysis).
Data in b and d show log2 transformed values. Whiskers represent min to max, box extends from the 25th to the 75th percentile, middle line represents the median. Single points represent individual values. Group differences of * >80% or **>90% are shown for Bayesian analysis.
