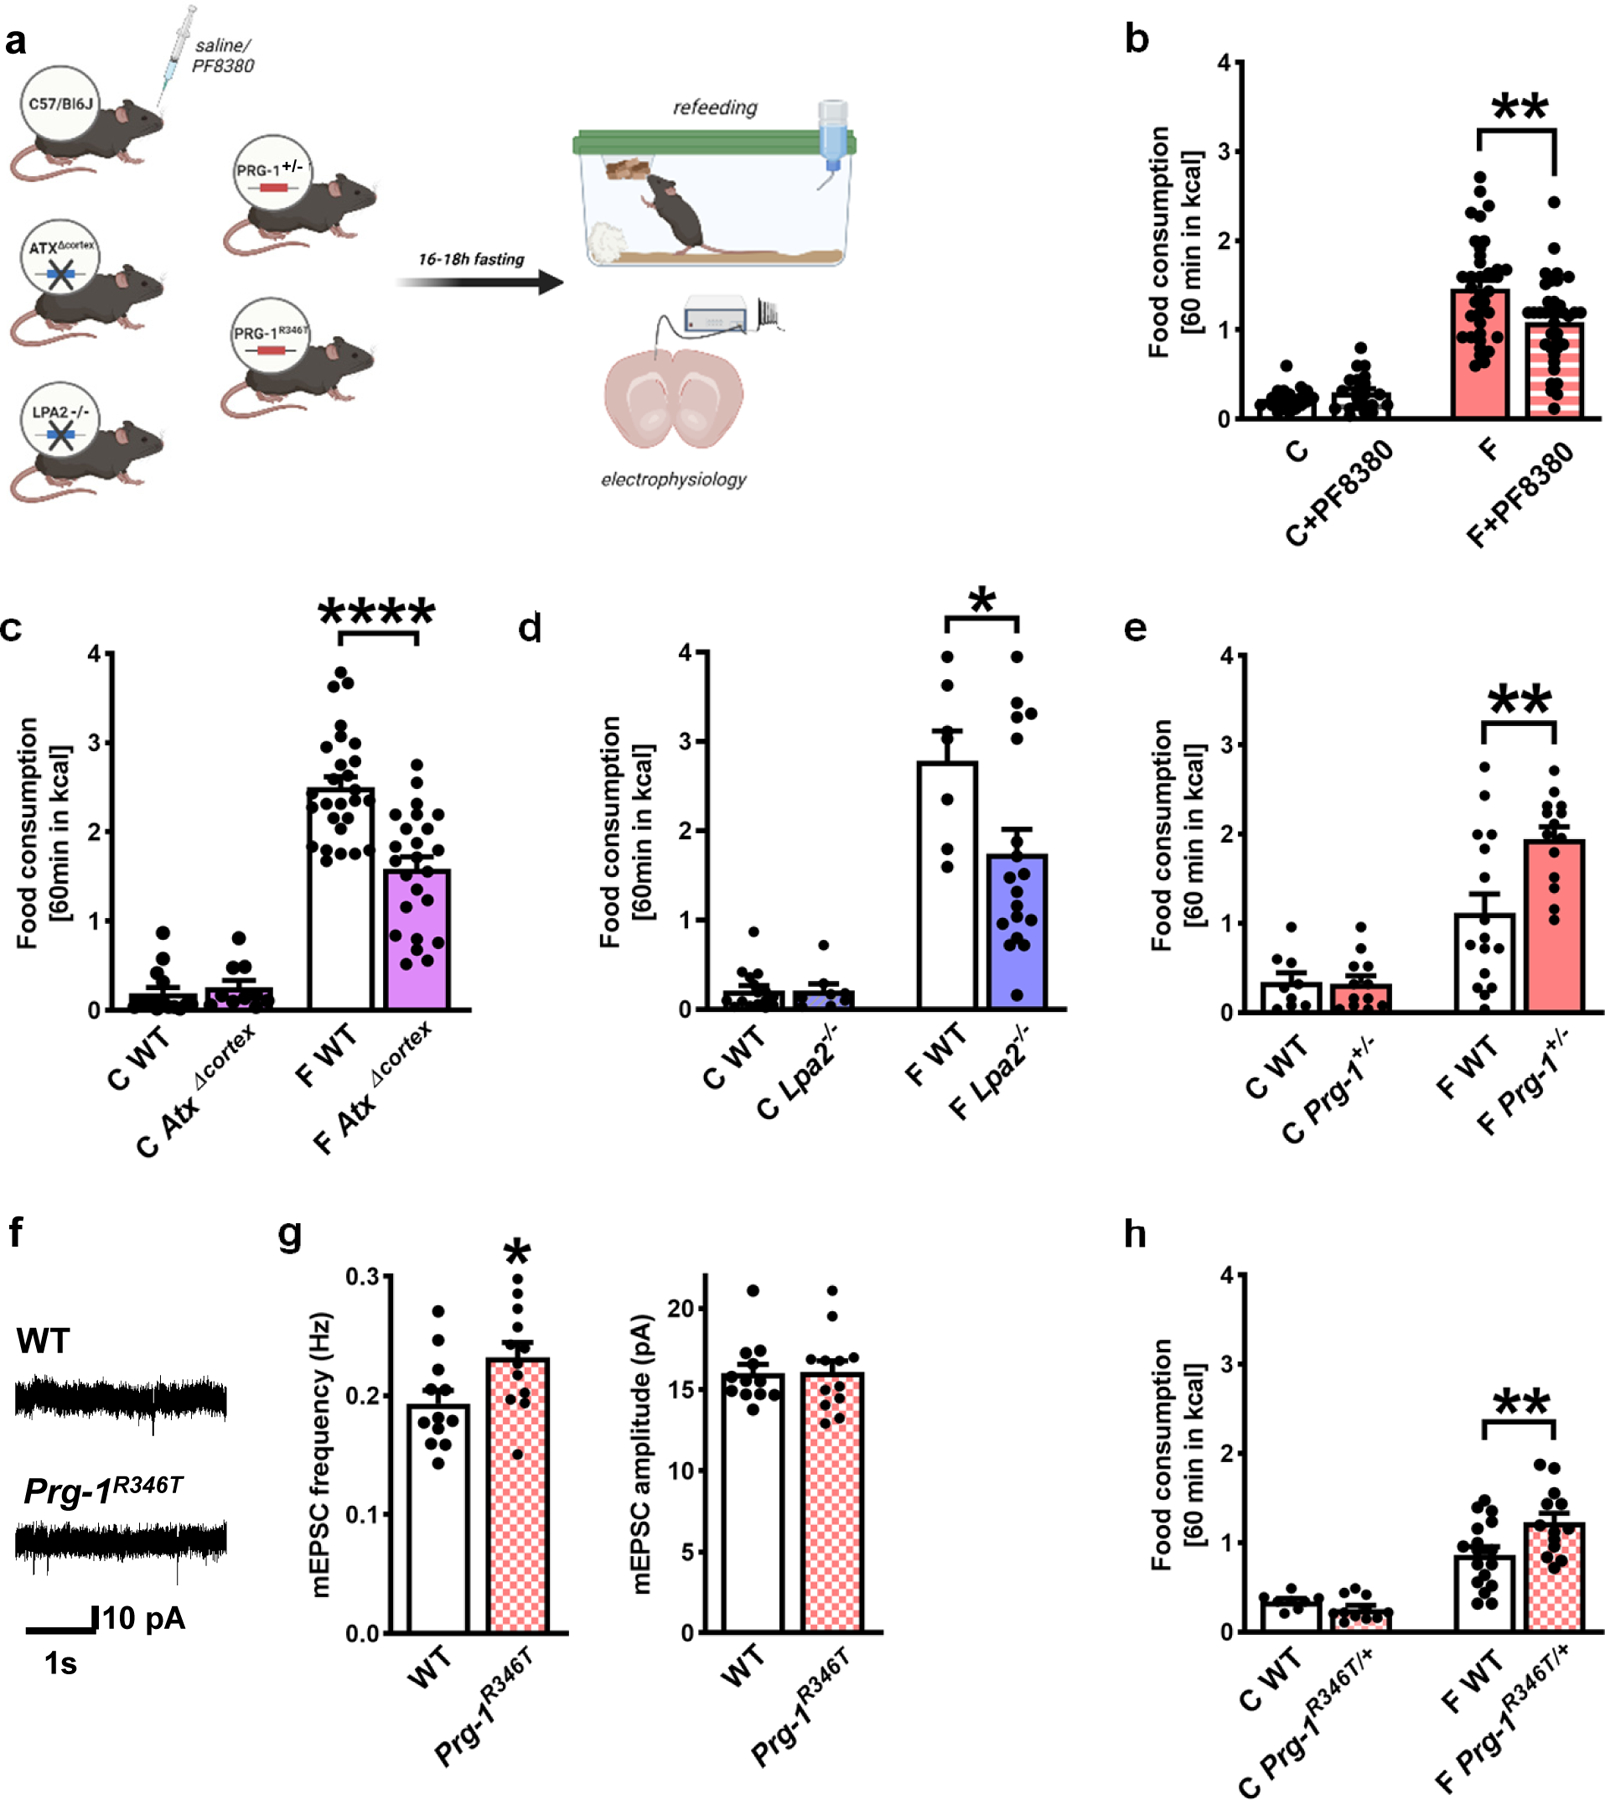
Figure 2. Fasting-induced hyperphagia is regulated by cortical synaptic lipid signaling.

a. Experimental design.
b. Disruption of LPA-signaling by systemic ATX-inhibition (by PF8380) did not alter food intake under non-fasting conditions (n = 20 C, n = 21 C + PF8380, Mann-Whitney test), while ATX-inhibition significantly reduced fasting-induced hyperphagia (n = 36 F and n = 37 F + PF8380, P=0.0028, two-tailed t-test).
c. Food intake under control conditions was comparable in non-fasted WT and AtxΔcortex mice (n = 15 C WT and n = 10 AtxΔcortex, two tailed t-test), while fasting-induced hyperphagia was significantly reduced in AtxΔcortex mice when compared to their WT litters (n = 27 F WT and n = 24 F AtxΔcortex mice, P<0.0001, two tailed t-test)
d. Food intake under control conditions was not different in Lpa2−/− mice when compared to their WT litters (n = 16 C WT and n = 8 Lpa2−/−), however, fasting-induced hyperphagia was significantly reduced in Lpa2−/− mice when compared to their WT litters (n = 7 F WT and n = 18 F Lpa2−/− mice, P=0.031, two tailed t-test).
e. Food consumption under non-fasted, control conditions was similar in PRG-1+/− (n = 12) and their WT litters (n = 9, two-tailed t-test). However, after overnight fasting, fasting-induced hyperphagia was significantly increased in PRG-1+/− mice when compared to their wild type litters (n = 16 fasted WT and 14 fasted Prg-1+/− mice, P=0.003, two-tailed t-test).
f. Original traces of mEPSCs from Prg-1R346T mice and WT litters.
g. mEPSC showed significantly increased mEPSC frequencies with unaltered amplitudes in Prg-1R346T mice (n = 12 WT and n = 12 PRG-1R346T, P=0.028, two-tailed t-test).
h. Under non-fasting, control conditions food intake was not different between mice expressing the human PRG-1R345T SNP (Prg-1R346T/+ mice) and their WT litters (n = 8 C WT, n = 11 Prg-1R346T/+). After fasting, however, Prg-1R346T/+ mice displayed significantly increased fasting induced hyperphagia when compared to their WT litters (n = 17 F WT and n = 13 F Prg-1R346T/+ mice, P=0.007,one-tailed t-test).
Bars represent mean and SEM, points represent individual values. *p<0.05, **p<0.01, ****p<0.0001. Illustration was created with BioRender.
