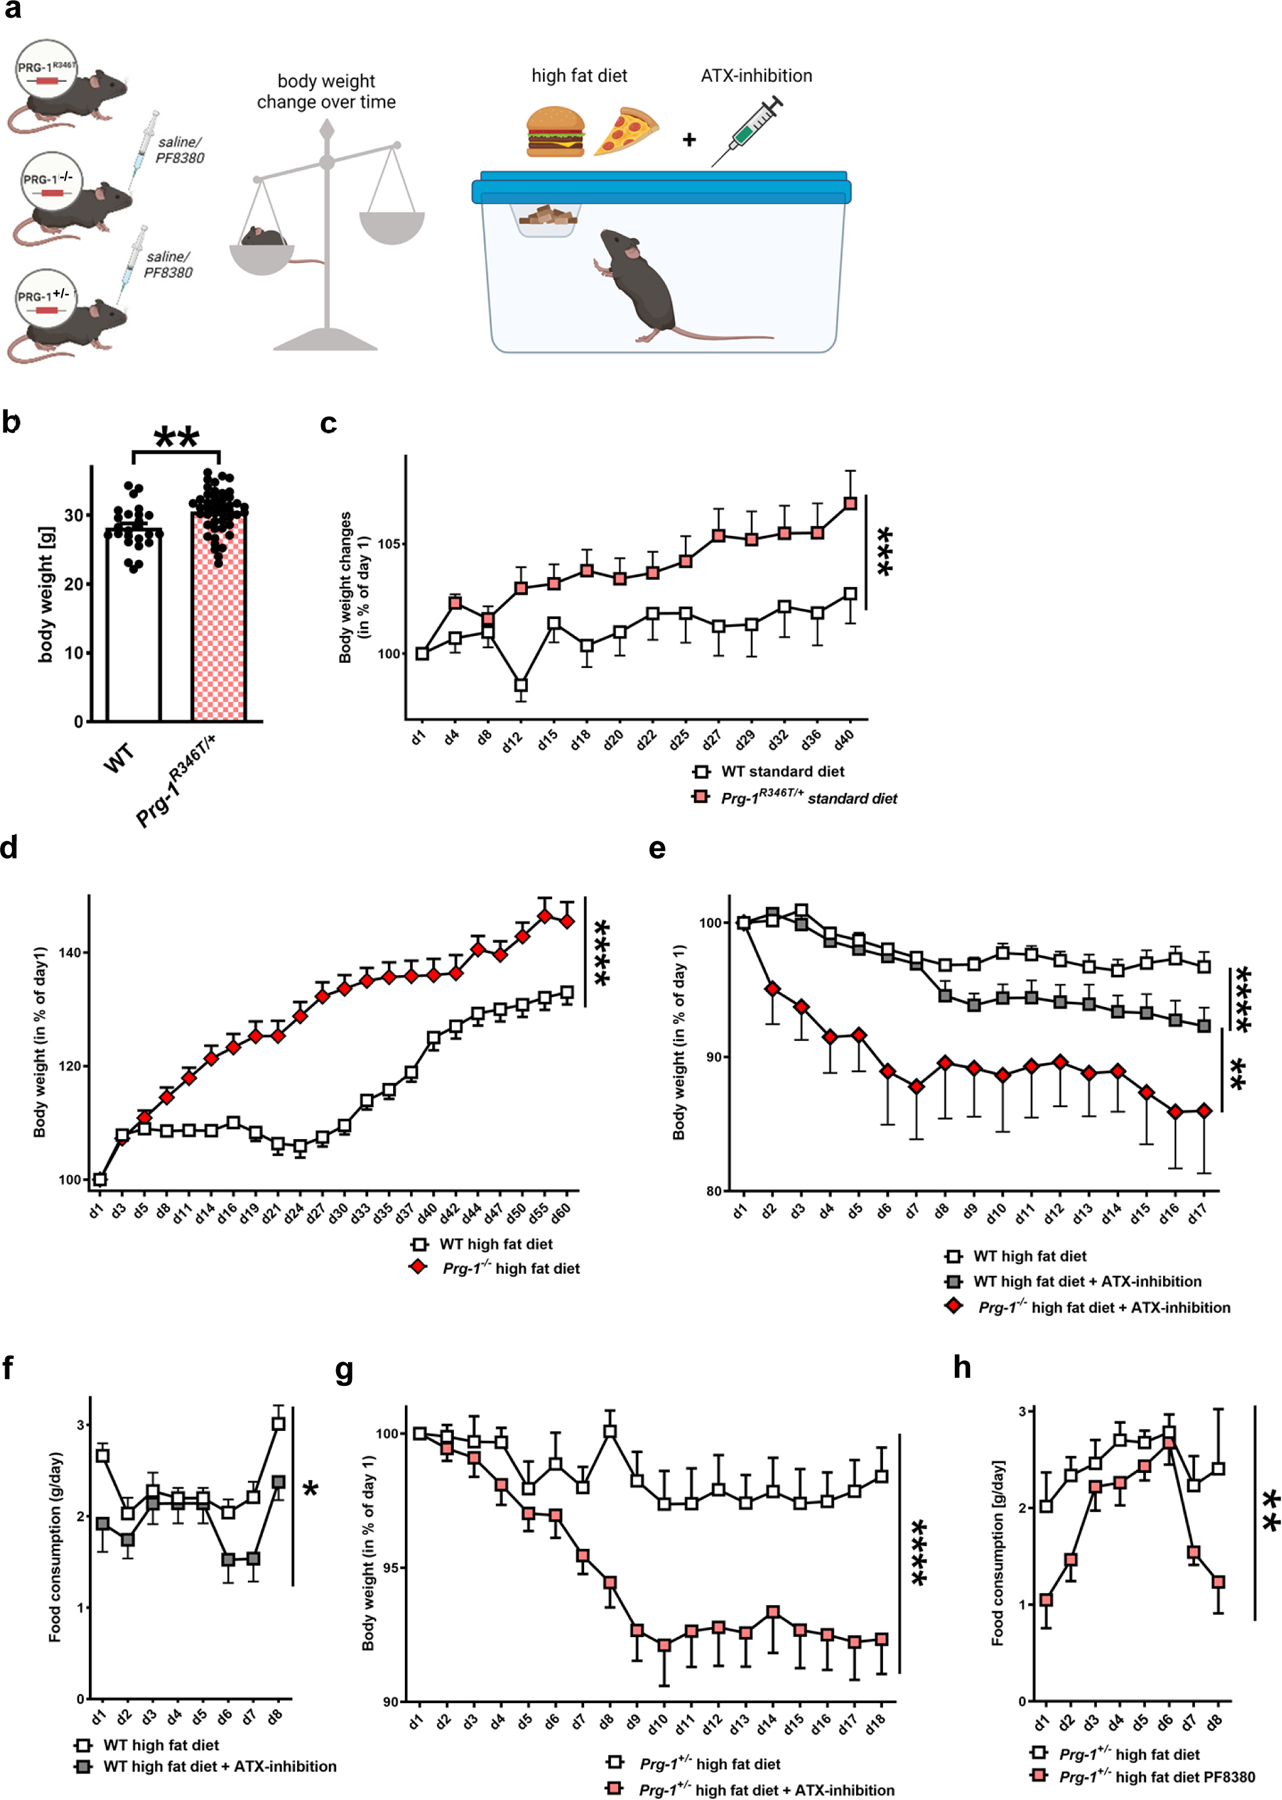
Figure 3. Synaptic lipid signaling modulates body weight under control diet and under high fat diet.

a. Experimental design.
b. Prg-1R346T/+ (17,1 ± 3 weeks) mice display significantly higher BW than WT at similar age (WT 16,9 ± 3 weeks) (n = 25 WT mice and 46 Prg-1R346T/+ mice, P=0.0032, two-sided t-test).
c. BW changes over 6 weeks (+/− 1 day started at around 17 weeks) on standard diet revealed higher increase in Prg-1R346T/+ animals (n = 25 WT mice and 31 Prg-1R346T/+ mice, 2 way ANOVA, P=0.0008 for days on standard food x genotype).
d. Prg-1−/− animals show higher increase in BW during a high fat diet when compared to WT mice (n = 27 WT mice and 12 Prg-1−/− mice, 2-way RM ANOVA, P<0.0001, days on high fat diet x genotype).
e. ATX-inhibition by PF8380 under continuation of high fat diet resulted in significant weight loss in WT animals when compared to non-treated WT animals. However, Prg-1−/− animals under ATX-inhibition by PF8380 displayed significantly higher weight loss than WT mice under ATX-inhibition by PF8380 (n = 13 WT, 14 WT + PF8380 animals and 5 Prg-1−/− + PF8380 animals, P<0.0001, 2-way RM ANOVA, time x PF-8380-treatment for WT vs. WT+PF8380 and PF-8389 treatment x genotype for WT+PF8380 and PRG-1−/−+PF8380, P=0.008, 2-way RM ANOVA).
f. Food intake under ATX-inhibition by PF8380 was significantly reduced in WT mice (n = 13 controls and 14 PF-8380 treated WT animals, 2way RM-ANOVA, P=0.044, PF8380 treatment)
g. Following high fat diet, ATX-inhibition by PF8380 under continuation of high fat diet resulted in significant BW reduction in treated Prg-1+/− mice when compared to non-treated Prg-1+/− mice (n = 16 Prg-1+/− mice and 18 Prg-1+/− PF8380 treated mice, 2way RM ANOVA, P<0.0001, time x PF8380 treatment)
h. Food intake in Prg-1+/− animals was signficantly reduced following ATX-inhibition by PF8380 (n = 9 Prg-1+/− mice and 9 Prg-1+/− PF8380-treated mice, 2way RM ANOVA, P=0.0076, Pf8380 treatment)
Dots show single values, bars represent mean, error bars represent SEM, which are shown for better visibility in c-h only in one direction. p*<0.05, p**<0.01, p***<0.001, p****<0.0001. Illustration was created with BioRender.
