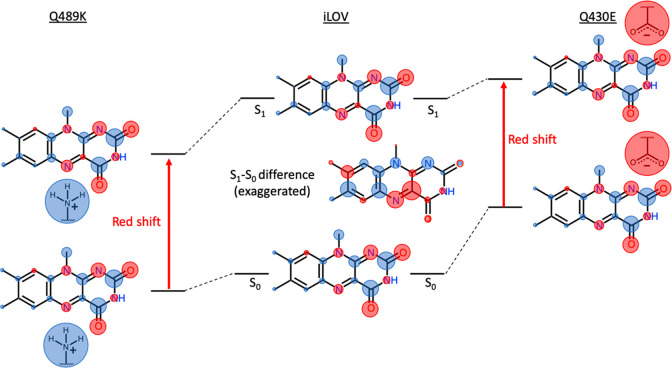
Figure 5.
(Center) LoProp charge population analysis (with hydrogen atom charges summed onto the heavy atoms to which they are connected) for lumiflavin in its ground (S0) and first singlet excited (S1) states. Red circles indicate negative charge density, and blue circles indicate positive charge density. The area of the circles is directly proportional to the charge on the corresponding atom. The S1 and S0 states have slightly different charge distributions that are difficult to discern without close inspection. Therefore, the difference in the atomic charges (S1 – S0) is also shown in the middle. In the S1 – S0 difference plot, the areas of the circles are proportional to the magnitude of the charge difference between S0 and S1, with red circles indicating reduced charge (higher electron density) on the atom after excitation from S0 to S1 and blue circles indicating increased charge (lower electron density). (Left) Scheme illustrating the effect of placing a positively charged lysine side chain close to the flavin N5/C4a, which would result in a red shift (see the text for details). (Right) Scheme illustrating the effect of placing a negatively charged glutamate side chain close to the flavin N1, which should also result in a red shift (see the text for details).

