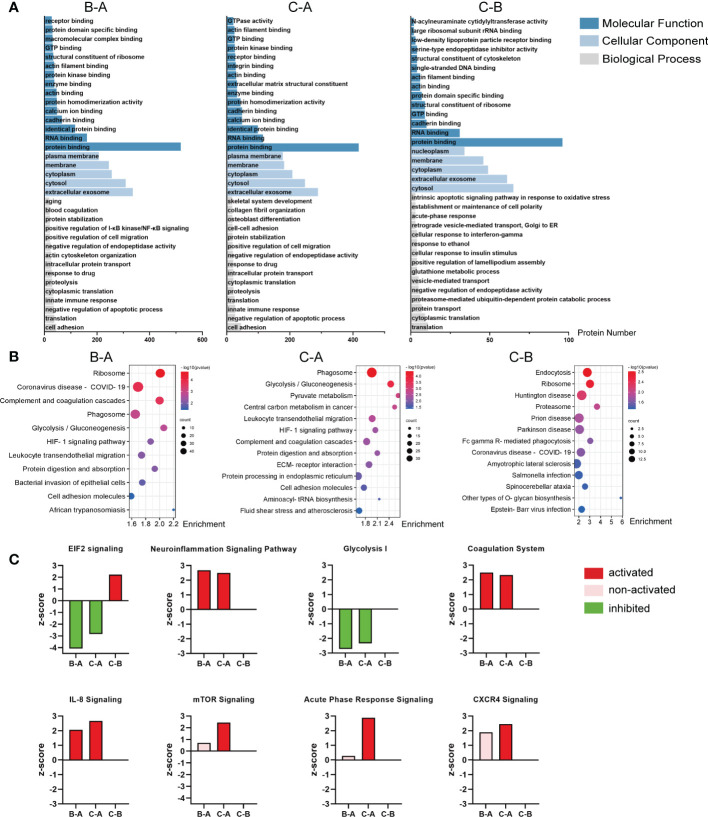
Figure 3.
Analysis of the DEPs from the pairwise comparison. (A) Representative GO enrichment in the three pairwise comparison groups; the horizontal axis indicates the number of enriched genes. (B) Bubble plot of KEGG enrichment analysis of the three comparison groups; the color of the bubble represents the enriched p-value, and the size of the bubble represents the number of enriched genes. (C) Activation or inhibition of several canonical signaling pathway in the three comparison groups. Z-score >2 means the pathway is activated, indicated in red, while z-score <−2 means the pathway is inhibited, indicated in green; the pink bar means non-activated pathway; and the missing values in the C–B groups mean no valid prediction. In the chart, B–A refers to middle-aged individuals compared with children, C–A refers to older patients compared with the middle-aged individuals, and C–B refers to older patients compared with middle-aged individuals.

