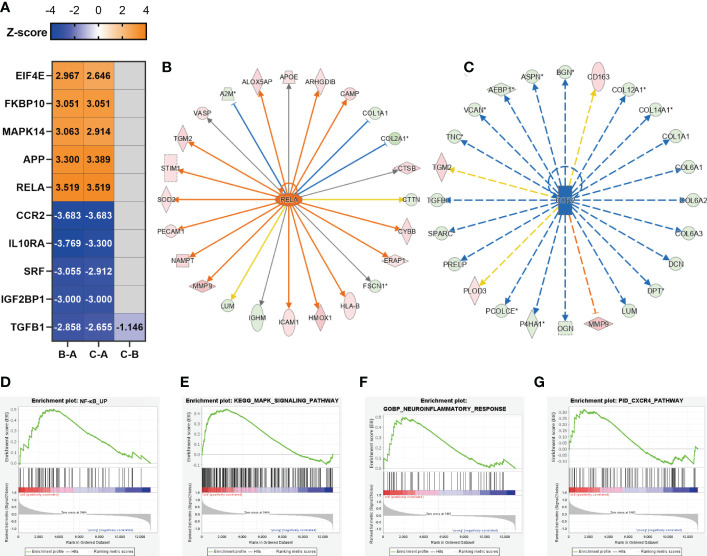
Figure 4.
Inflammation might be generated from osteocytes. (A) Representative predicted upstream transcription factors in the three comparison groups; the number indicates z-score. Z-score >2 means the molecular is activated, indicated in orange, while z-score <−2 means the molecular is inhibited, indicated in dark blue; the negative prediction was indicated in gray and the non-activated pathway was indicated in light blue. (B) The significantly activated molecule RELA and its regulatory map in the C–A groups. (C) The significantly inhibited molecule CCR2 and its regulatory map in the C–A groups. (D–G) GSEA plots of mRNA sets of several inflammatory-associated signaling pathways.

