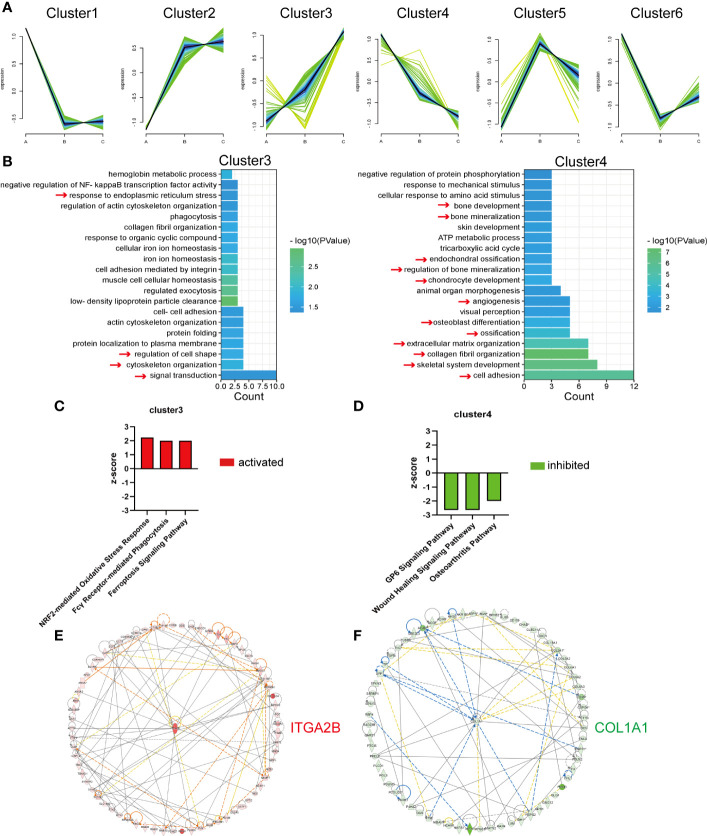
Figure 5.
Analysis of the DEPs continuously up- or downregulated with age. (A) Six clusters of the 513 DEPs in the three groups. A refers to the children, B refers to the middle-aged individuals, and C refers to the older individuals. (B) Representative biological process analysis of cluster 3 (left) and cluster 4 (right). (C, D) Activation or inhibition of several canonical signaling pathways in cluster 3 and cluster 4. (E, F) The core molecular of cluster 3 and cluster 4.

