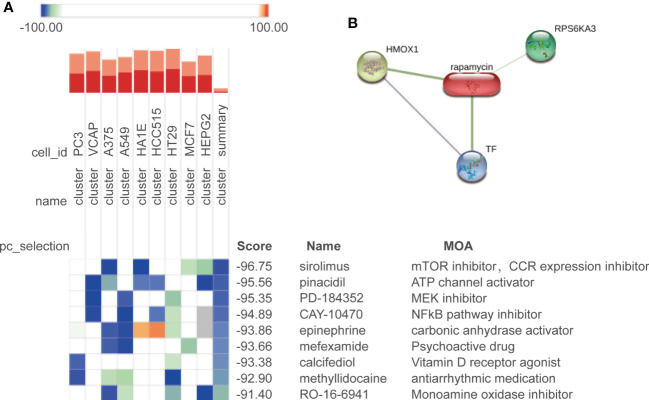
Figure 6.
Potential drug prediction. (A) Drug candidates predicted by CMap in nine cell types; colors of the heatmap represent the prediction scores: blue means negatively correlated to input genes, and orange means positively correlated to input genes. We show the drugs with a composite score of less than −90. (B) Correlation between the predicted drug rapamycin and its target.

