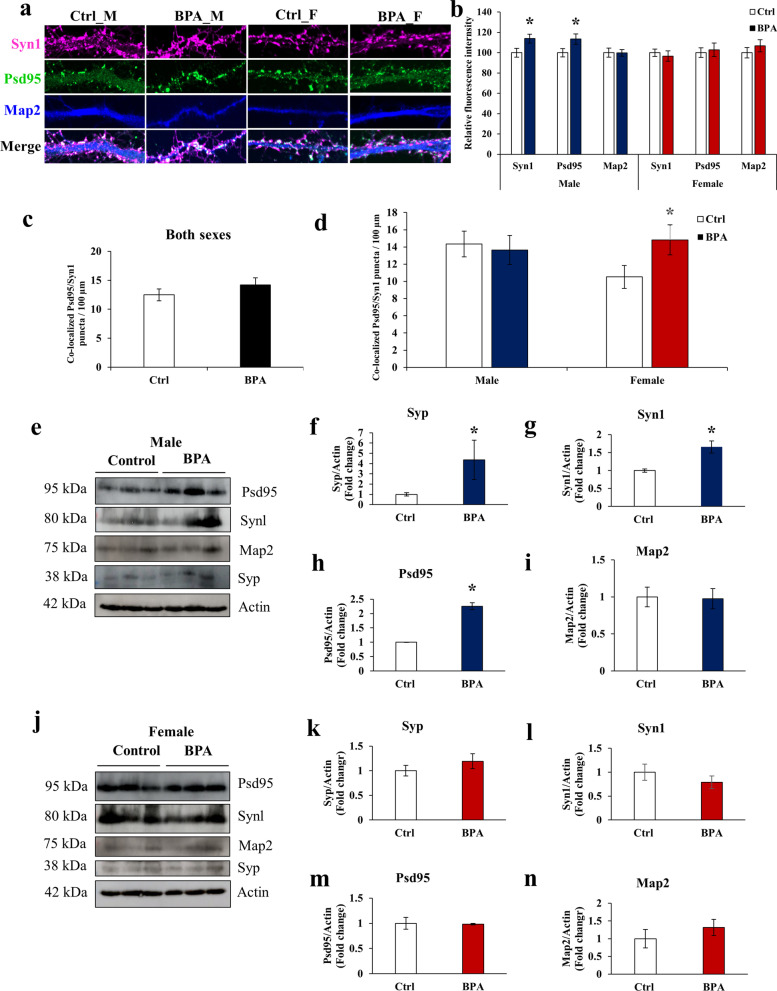
Fig. 7.
Prenatal BPA exposure disrupts synaptogenesis in the hippocampus of offspring in a sex-dependent manner. a–d Primary hippocampal neurons were isolated from neonatal rat pups (PND1) prenatally exposed to BPA or vehicle control. The hippocampal tissues from each sex of pups in the same litter were pooled into one sample and used for cell isolation. For each treatment group, a total of three samples for each sex of pups were used. Primary hippocampal neurons were cultured for 14 days and immunostained with rabbit anti-Syn1 (presynaptic marker), mouse anti-Psd95 (postsynaptic marker), and chicken anti-Map2 antibodies (mature neuron marker), followed by donkey anti-rabbit Alexa 647, donkey anti-mouse Alexa 488, and donkey anti-chicken Alexa 405 antibodies. The cells were then examined under a confocal laser scanning microscope. For each treatment group, a total of 45 mature neurons/sex were assessed. For each neuron, all neurites (approximately 3–5 neurites/neuron) were used for data analysis. a Representative immunofluorescence images of synapses on primary hippocampal neurons isolated from rat pups prenatally exposed to BPA or vehicle control. b Relative fluorescence intensities of Syn1, Psd95, and Map2 in primary hippocampal neurons (DIV14) from male and female pups exposed to BPA or vehicle control in utero. c Average number of colocalized Syn1 and Psd95 puncta per 100 µm when both sexes of pups in the same treatment group were combined into one group. d Average number of colocalized Syn1 and Psd95 puncta per 100 µm when male and female pups were analyzed separately. e–n Expression levels of synaptic proteins in the hippocampus of rat pups (n = 6 pups/treatment group; 3 males and 3 females from 3 different dams) were also assessed by Western blot analysis. e–i Expression levels of Syp, Syn1, Psd95, and Map2 proteins in the hippocampal tissues of male offspring prenatally exposed to BPA or control. j–n Expression levels of Syp, Syn1, Psd95, and Map2 proteins in the hippocampal tissues of female offspring prenatally exposed to BPA or control. Data are presented as the mean ± SEM. The differences between the two groups were analyzed using the two-tailed Student’s t-test. A p value < 0.05 was considered significant. *p value < 0.05

