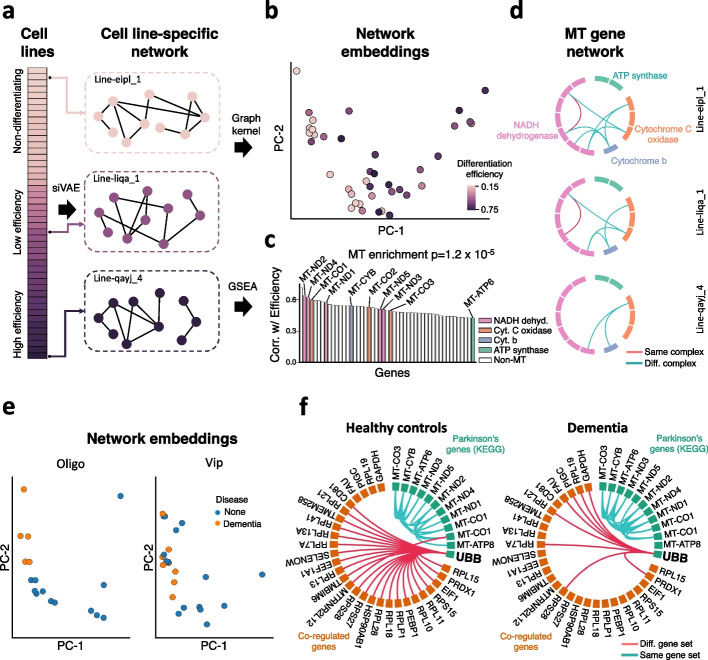
Fig. 6.
siVAE identifies gene modules whose connectivity correlates with cell population-level phenotypes. a Schematic illustrating how in experimental designs such as the NeurDiff dataset where there is a population of cells sequenced for each of several iPSC cell lines, then siVAE can be trained on each population separately to implicitly learn a gene co-expression network for each iPSC line. By conceptually ordering the cell lines by an iPSC line phenotype such as differentiation efficiency, siVAE can identify gene modules whose connectivity is correlated with differentiation efficiency. b Using a graph kernel, siVAE models representing different iPSC lines were embedded into a single scatterplot in which each cell line is represented by a single point, and two cell lines are proximal in the scatterplot if their respective gene co-expression networks are globally similar in structure. c Bar plot indicating the Spearman correlation between estimated degree centrality and differentiation efficiency for top correlated genes. Each bar indicates a gene, and the colored bars indicate mitochondrial genes. Each color represents a different mitochondrial complex. d Visualization of edges connecting mitochondrial genes in the siVAE inferred gene network for three selected cell lines. For each cell line, only seven edges between mitochondrial genes are considered for visualization; these seven edges represent those edges that are significantly negatively correlated with differentiation efficiency. e Scatterplot of donor embeddings in the DementiaDataset. Each point represents a donor’s network, and the donor is colored by dementia case-control status. Network embeddings are shown for both oligodendrocytes and Vip interneurons. f Visualization of edges between the KEGG Parkinson’s Disease gene set and their network neighbors, for both cases and controls. The edges were summarized for cases and controls separately by only keeping edges that were present in at least 20% of the donors within each case-control group

