Fig. 1.
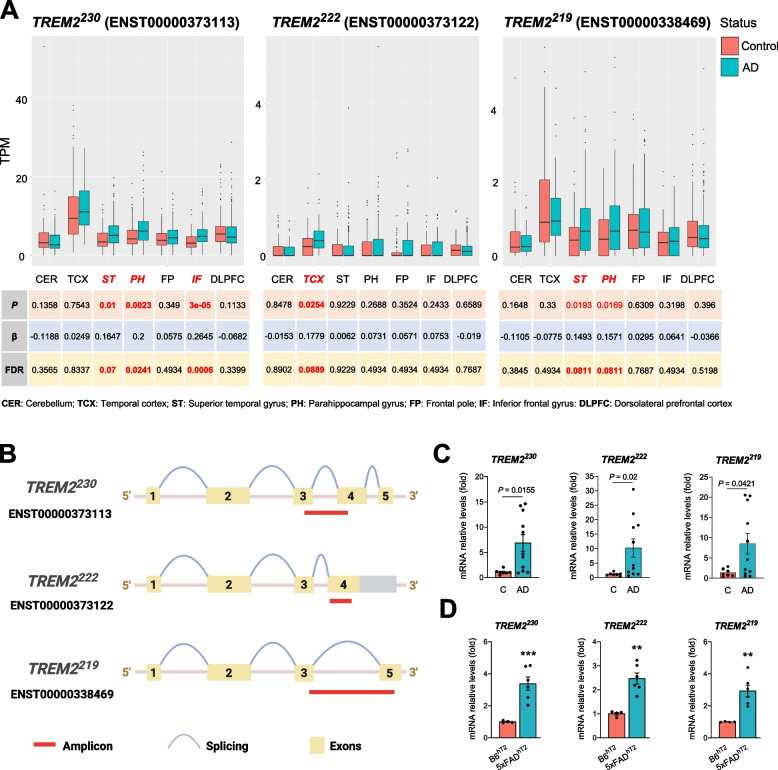
TREM2 isoforms expression increases in Alzheimer’s disease. A Expression analysis of TREM2 isoforms (TREM2230, TREM2222, and TREM2219) in different brain regions in control subjects (Control) and patients with late-onset Alzheimer’s disease (AD) using the AMP-AD dataset. B Design of qPCR primers to specifically detect TREM2 isoforms. C qPCR expression analysis of TREM2 isoforms in middle frontal gyrus tissue of control subjects (C) and patients with Alzheimer’s disease (AD). Statistical analysis was performed by the Student t-test for TREM2230 and Mann-Whitney test for TREM2222 and TREM2219. D qPCR expression analysis of TREM2 isoforms in brain cortical tissue of 7-month-old control and 5xFAD mice expressing human TREM2 gene (B6hT2and 5xFADhT2). Animals from both sexes were analyzed together (3 males and 1 female B6hT2; 3 males and 3 females 5xFADhT2). Statistical analysis was performed by the Student t-test. Data are expressed as mean values ± SEM (**P < 0.01; ***P < 0.001)

