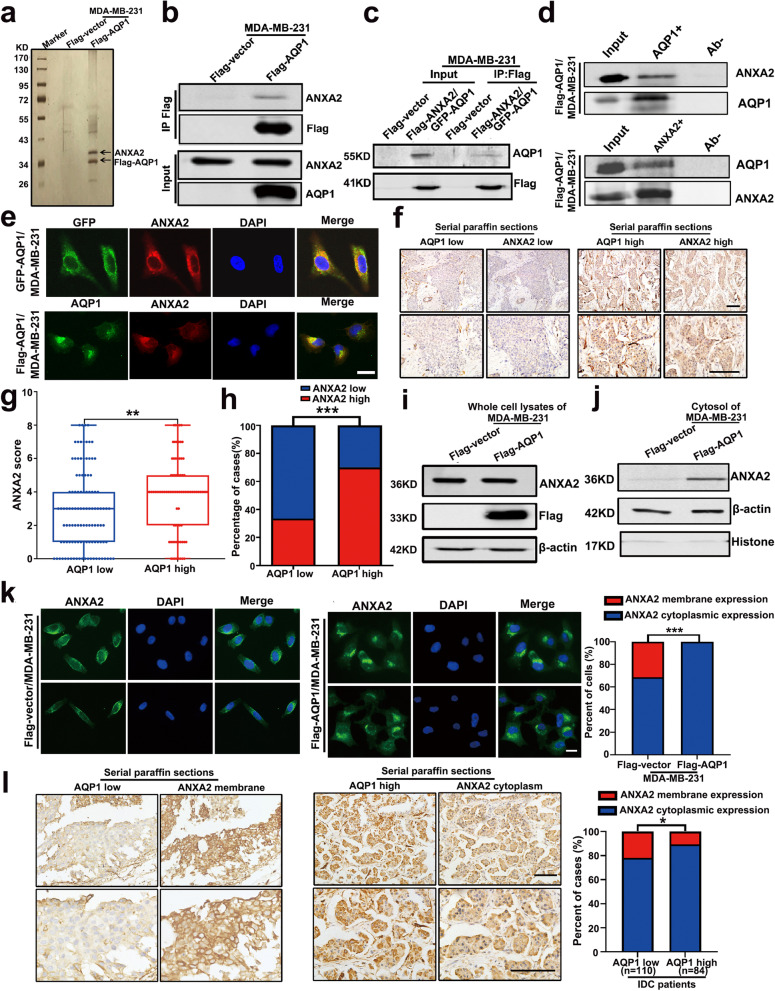
Fig. 3.
AQP1 interacted with ANXA2 and recruited it from the cell membrane to the cytoplasm. a Cellular extracts from MDA-MB-231 cells stably transfected Flag-vector or Flag-AQP1 were immunopurified with anti-Flag affinity beads and eluted with Flag peptides. The eluates were resolved on SDS-PAGE and silver-stained followed by mass spectrometry analysis. b-c Immunoprecipitation experiments were performed by using an anti-flag M2 affinity gel and then immunoblotted with ANXA2 or AQP1 antibodies. d Whole cell lysates from Flag-AQP1/MDA-MB-231 cells were immunoprecipitated with anti-ANXA2 or anti-AQP1 and then immunoblotted with antibodies against the indicated proteins. e Immunofluorescence analysis showed the colocalization of AQP1 and ANXA2 in GFP-AQP1/MDA-MB-231 and Flag-AQP1/MDA-MB-231 cells. Scale bar = 20 μm. f Immunohistochemical staining of 194 serial paraffin sections was performed to detect the expression of AQP1 and ANXA2. Scale bar = 100 μm. g Cytoplasmic ANXA2 score in AQP1 high expression group was higher than in AQP1 low expression group in 194 serial paraffin sections (two-tailed Student’s t test, P = 0.0034, **P < 0.01). h 70.2% (59/84) IDC patients exhibited high ANXA2 cytoplasmic expression in AQP1 high cytoplasmic expression group, while the percent of high ANXA2 cytoplasmic expression cases was only 33.6% (37/110) in AQP1 low cytoplasmic expression group (Chi-square test, P = 0.000, ***P < 0.001). i Western blot analysis of ANXA2 expression in Flag-vector/MDA-MB-231 and Flag-AQP1/MDA-MB-231 cells. j Western blot analysis of cytoplasmic ANXA2 expression in the cytosol of Flag-vector/MDA-MB-231 and Flag-AQP1/MDA-MB-231 cells. k Immunofluorescent assay showed the cellular location of ANXA2 in Flag-vector/MDA-MB-231 and Flag-AQP1/MDA-MB-231 cells (n = 194–197 cells per group, Chi-square test, ***P < 0.001). Scale bar = 20 μm. l Immunohistochemical staining of 194 serial paraffin sections was performed to detect the expression of AQP1 and ANXA2. 21.8% (24/110) IDC patients exhibited ANXA2 membrane expression in AQP1 low cytoplasmic expression group, while the percent of ANXA2 membrane expression cases was only 10.7% (9/84) in AQP1 high cytoplasmic expression group (Chi-square test, P = 0.041, *P < 0.05). Scale bar = 100 μm. All in vitro experiments were repeated at least 3 times

