
Fig. 6.
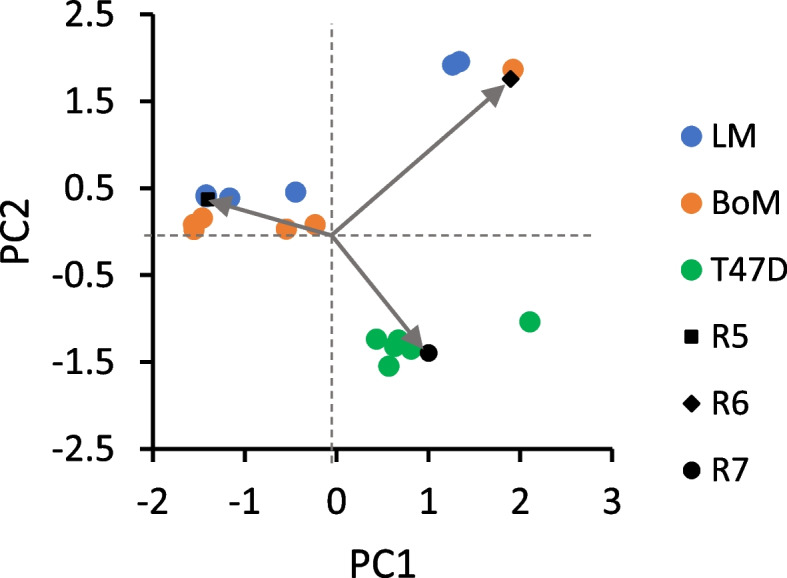
Bi-plot of Loadings and Scores from principal component analysis of Table 2 data. Flux ratios R5-R7 (see Table 2) were determined from Model 2 by simulating 13C serine labeling from [1,2-13C] glucose, using [13C] 3-phosphoglycerate labeling simulated by Model 1 (Table 3). The Scores reflecting individual experiments clustered into two groups—the less malignant T47D line and the LM/BoM lines, indicating differences in relative folate cycle fluxes for more vs. less malignant cells. MDA-MB-231 cells were not analyzed since there was no significant 13C enrichment in serine. The Loadings are indicated by arrows and provide information on relative strength of correlations between the variables R5–R7 used to simulate 13C serine labeling