Fig. 5.
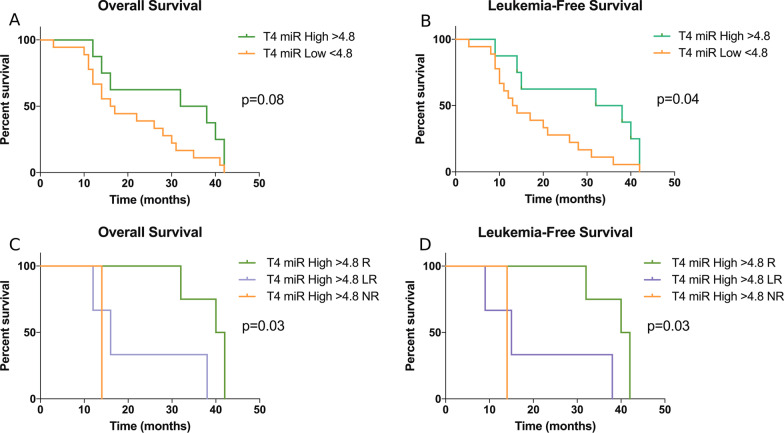
Prognostic significance of miR-192-5p in MDS patients at the 4th cycle of AZA + LEN treatment. A Kaplan–Meier curve comparing overall survival in twenty-six patients showing high (> 4.8) and low (< 4.8) miR-192-5p level at the 4th cycle of therapy (T4). P values were determined using a log-rank test. B Kaplan–Meier curve comparing leukemia-free survival in twenty-six patients showing high (> 4.8) and low (< 4.8) miR-192-5p level at the 4th cycle of therapy (T4). p values were determined using a log-rank test. C Kaplan–Meier curve comparing overall survival in MDS patients showing high (> 4.8) miR-192-5p level at the 4th cycle of therapy (T4) and divided according to the response to therapy in responders (R), losing response (LR) and non-responders (NR). p values were determined using a log-rank test. D Kaplan–Meier curve comparing leukemia-free survival in MDS patients showing high (> 4.8) miR-192-5p level at the 4th cycle of therapy (T4) and divided according to the response to therapy in responders (R), losing response (LR) and non-responders (NR). p values were determined using a log-rank test

