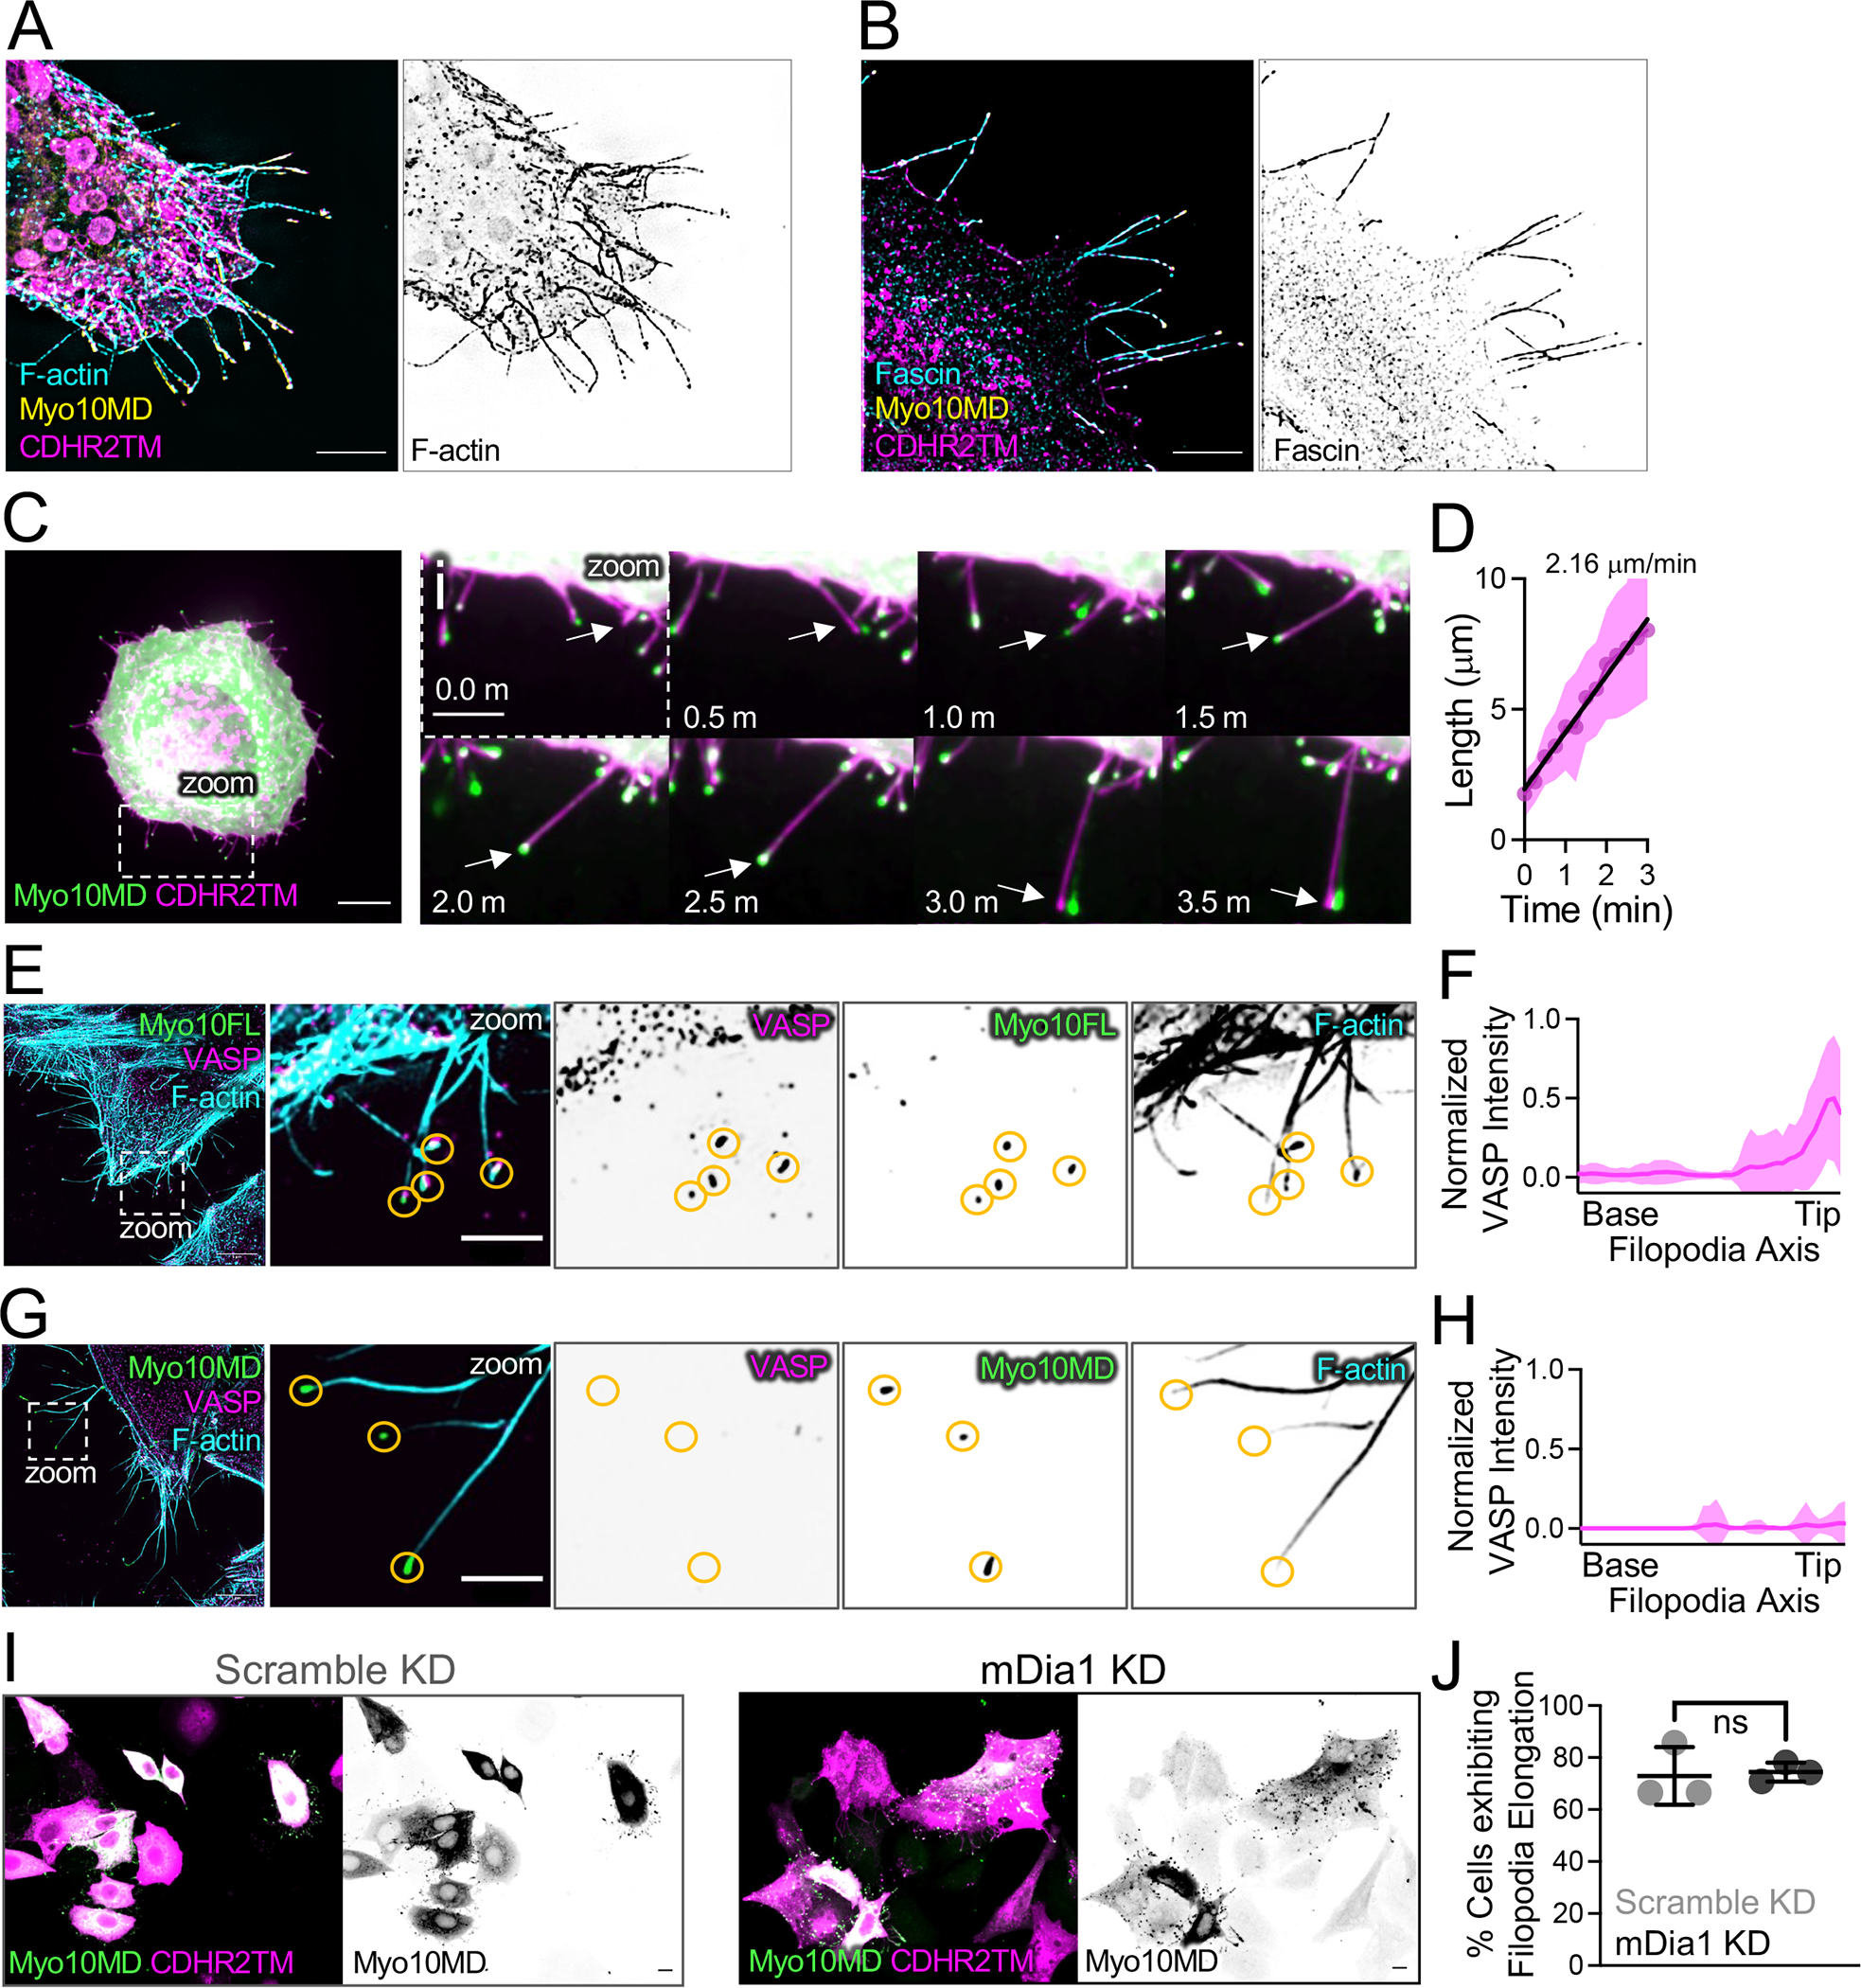
Figure 2: Protrusions induced by membrane bound Myo10MD exhibit features of filopodia.

(A) SIM maximum intensity projection image of a HeLa cell expressing Myo10MD (yellow) and CDHR2TM (magenta) and stained for F-actin with phalloidin (cyan). Panel to the right shows inverted single channel image of F-actin (phalloidin). Scale bar = 5 μm. (B) SIM maximum intensity projection image of HeLa cells expressing Myo10MD (yellow) and CDHR2TM (magenta) and stained for endogenous fascin (cyan). Panel to the right shows inverted single channel image of fascin. Scale bar = 5 μm. (C) Confocal maximum intensity projection of HeLa cell expressing Myo10MD (green) and CDHR2TM (magenta) 2 min after rapalog addition. Scale bar = 10 μm. (Ci) Montage of zoomed in region (C) highlighting the growth of a single filopodium (white arrow). (D) Elongation rate of single filopodium induced by rapalog treatment. Rate was calculated via the slope using a simple linear regression; n = 14 individual filopodia from n = 3 separate cells. (E) SIM maximum intensity projection image of a HeLa cell expressing full-length Myosin-10 (green) and stained for endogenous VASP (magenta) and F-actin with phalloidin (cyan). Zoom images to the right show merge and inverted single channel images. Yellow circles denote the tips of individual filopodia. (F) Line scans parallel to the filopodial axis show the intensity distribution of VASP in filopodia generated from over-expressing EGFP-myosin-10 full length; n = 30 protrusions, line represents the average intensity. (G) SIM maximum intensity projection image of a HeLa cell expressing Myo10MD (green) and CDHR2TM (not shown) 25 min after rapalog treatment and stained for endogenous VASP (magenta) and F-actin (cyan). Zoom images to the right show merge and inverted single channel images. Yellow circles denote the tips of individual filopodia. For E and G, scale bar = 5 μm, zoom scale bar = 2 μm. (H) Line scans parallel to the filopodial axis show the intensity distribution of VASP in filopodia; n = 39 filopodia, line represents the average intensity. (I) Confocal maximum intensity projection of HeLa cells transfected with either non-targeting siRNA (scramble KD) or siRNA targeting mDia1 (mDia1 KD) and expressing Myo10MD (green) and CDHR2TM (magenta), imaged 25 min after rapalog treatment. Scale bars = 10 μm. (J) Percent of cells displaying filopodial elongation with or without KD of mDia1; n = 3 replicates with 87–93% knockdown efficiency. Double transfected cells/condition scramble KD (n = 184) and mDia1 KD (n = 63). Ns, p-value > 0.05 calculated using the unpaired Student’s t-test; all graph error bars represent the mean ± SD.
