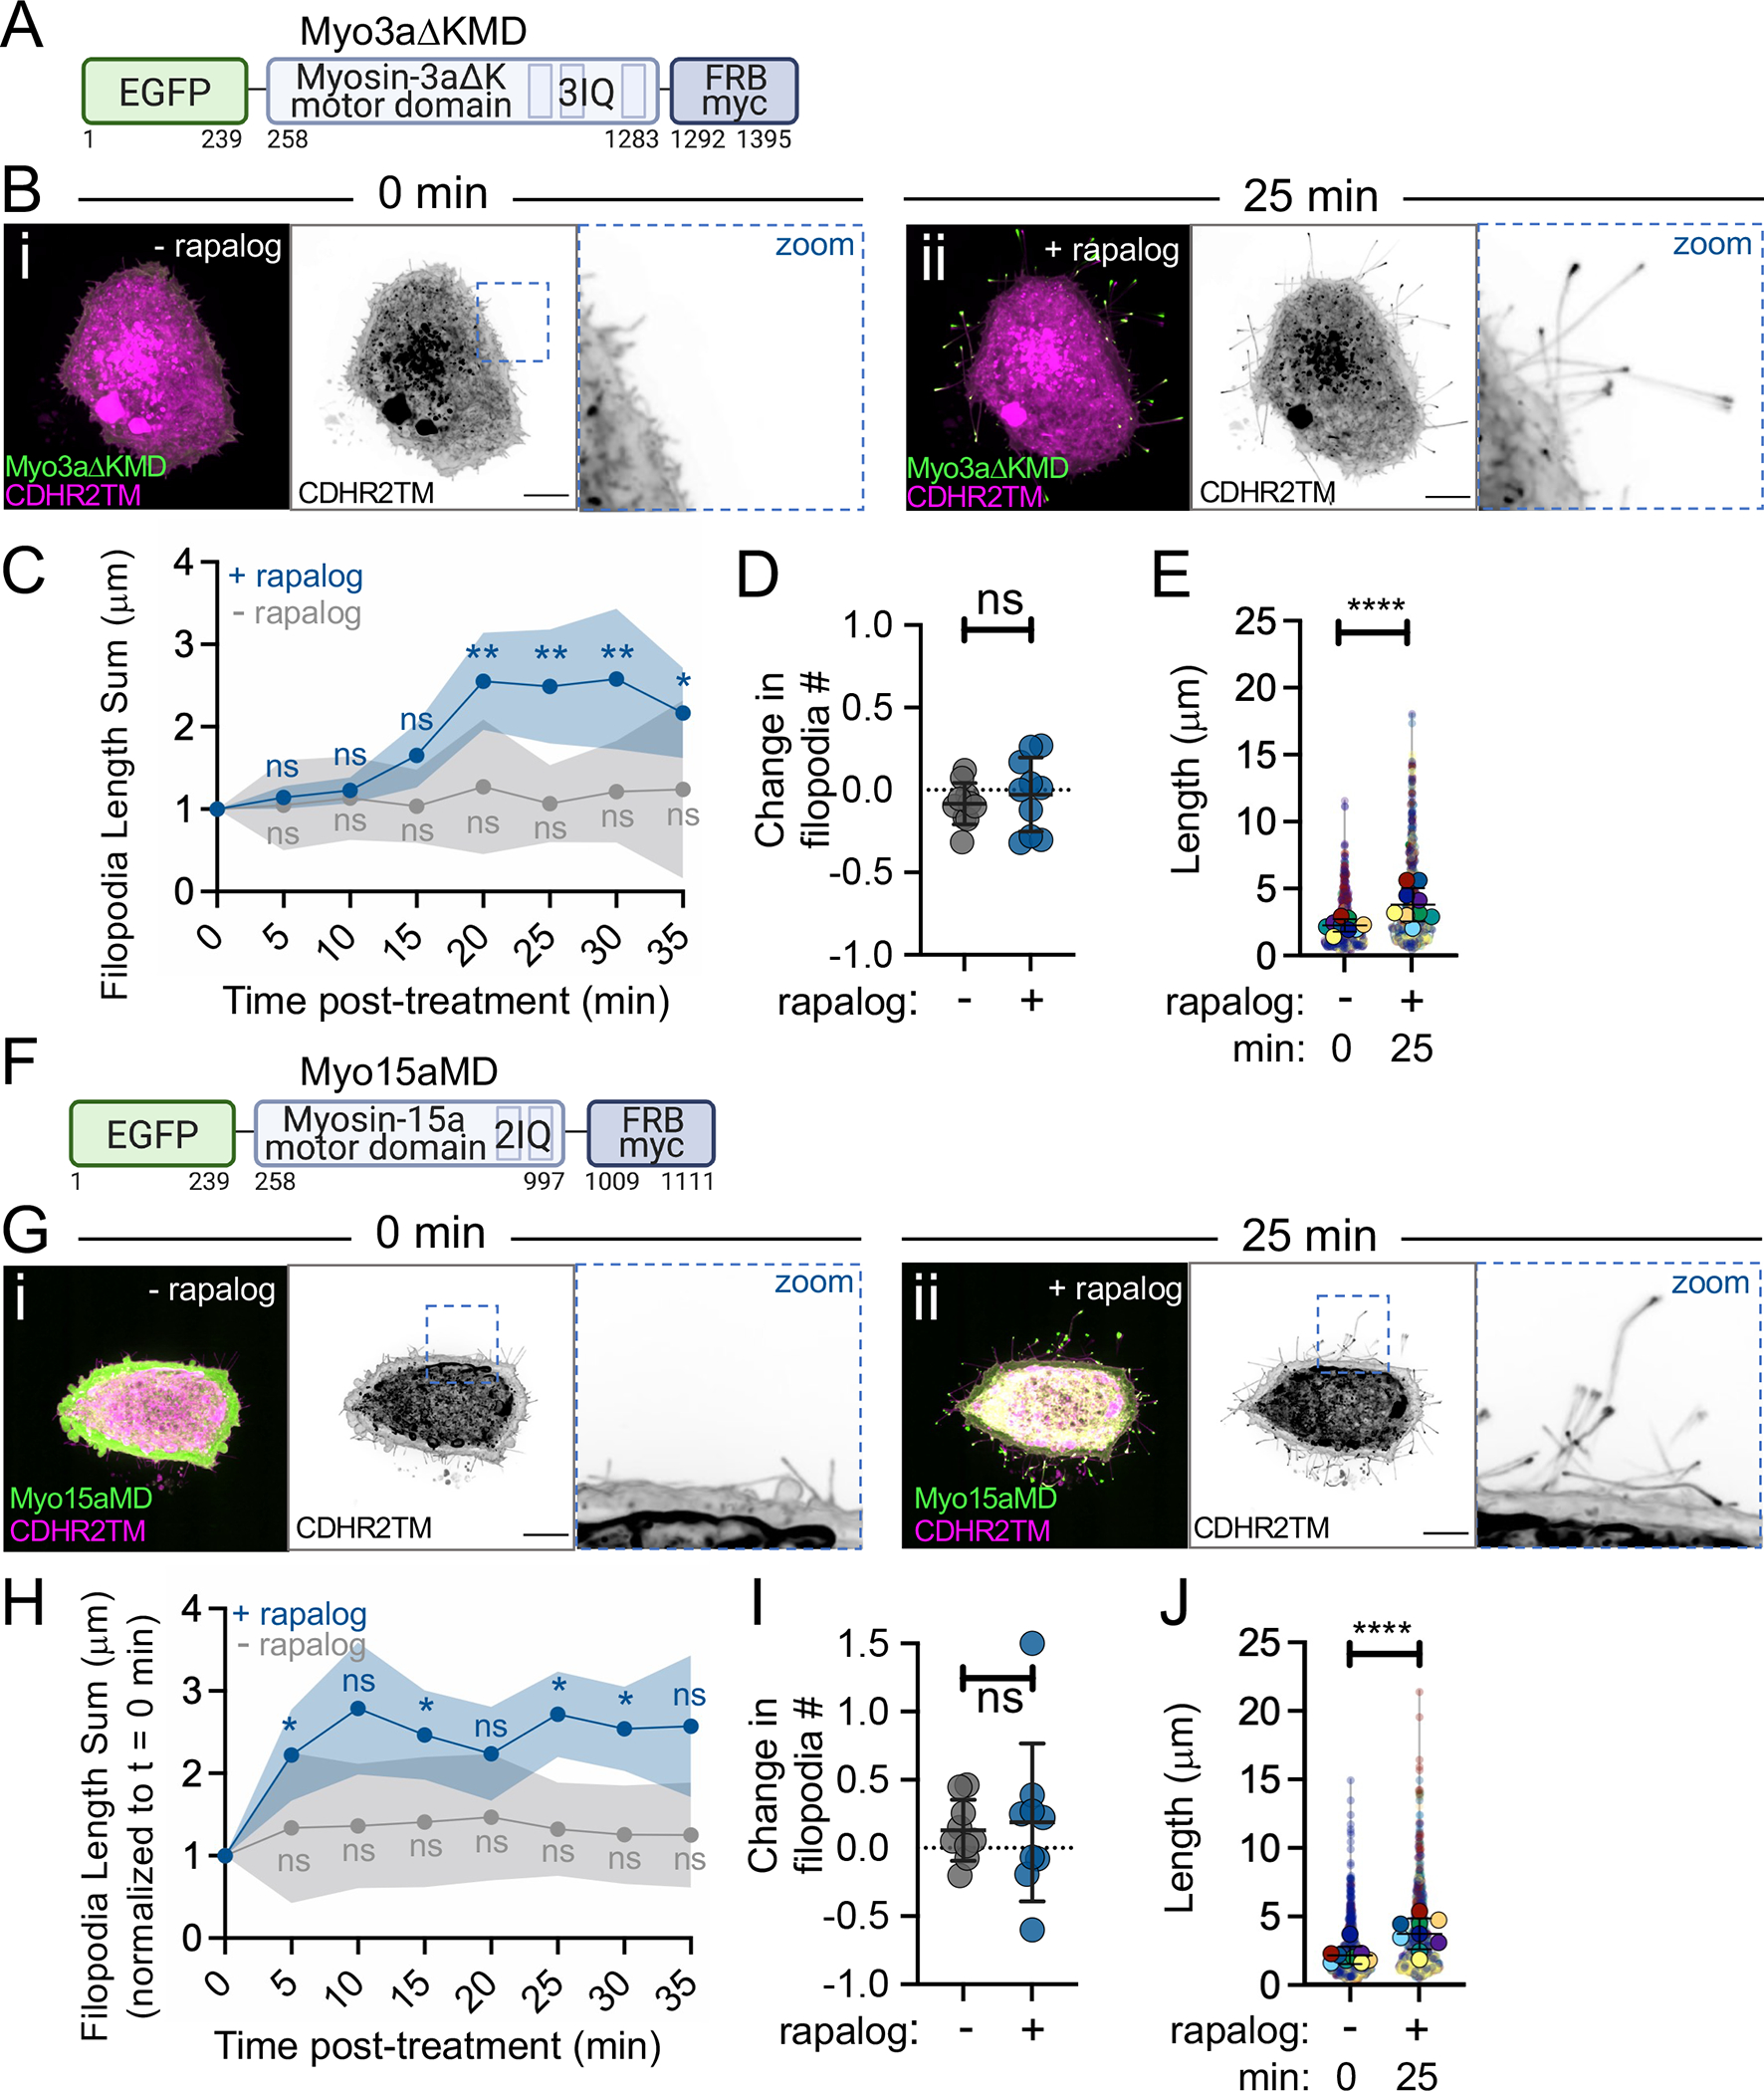
Figure 5: Motor domains from Myo3a and Myo15a also promote filopodia growth.

(A) Cartoon depicting the EGFP-Myo3aΔK motor domain-FRB-myc construct (Myo3aΔKMD); numbers below represent amino acids. (B) Confocal maximum intensity projection image of control HeLa cells expressing the Myo3aΔKMD (green) and CDHR2TM (magenta) at 0 min (i) and 25 min after (ii) rapalog treatment. (C) Length sum of filopodia over time in untreated (gray line) or rapalog-treated (blue line) HeLa cells expressing Myo3aΔKMD and CDHR2TM; n = 14–16 cells per treatment. (D) Fractional change in filopodia number from 0 min to 25 min in untreated (gray) or rapalog treated (blue) HeLa cells expressing Myo3aΔKMD and CDHR2TM; n = 10 cells per condition. (E) Filopodia length at 0 and 25 min post rapalog treatment in HeLa cells expressing Myo3aΔKMD and CDHR2TM; n = 9 cells, n = > 670 protrusions. (F) Cartoon depicting the EGFP-Myosin-15a motor domain-FRB-myc construct (Myo15aMD); numbers below represent amino acids. (G) Confocal maximum intensity projection images of control HeLa cells expressing Myo15aMD (green) and CDHR2TM (magenta) before (i) and 25 min after (ii) rapalog treatment. (H) Length sum of filopodia over time in untreated (gray line) or rapalog treated (blue line) HeLa cells expressing Myo15aMD and CDHR2TM; n = 13–16 individual cells per treatment. (I) Fractional change in filopodial number from 0 to 25 min in untreated (gray) or rapalog treated (blue) HeLa cells expressing Myo15aMD and CDHR2TM; n = 9 cells per condition. (J) Filopodia length measured at 0 and 25 min post rapalog treatment in HeLa cells expressing Myo15aMD and CDHR2TM; n = 9 individual cells, n = > 730 protrusions. Data in (E) and (J) are represented as a SuperPlot, where transparent circles represent the length of individual filopodia, opaque circles represent the average length of protrusions of individual cells, violin plots show the distribution of the data, and all color matched circles represent measurements from the same cell. All graph error bars represent the mean ± SD; ns p-value > 0.05, * p-value ≤ 0.05, ** p-value ≤ 0.01, **** p-value ≤ 0.0001. Scale bars = 10 μm.
