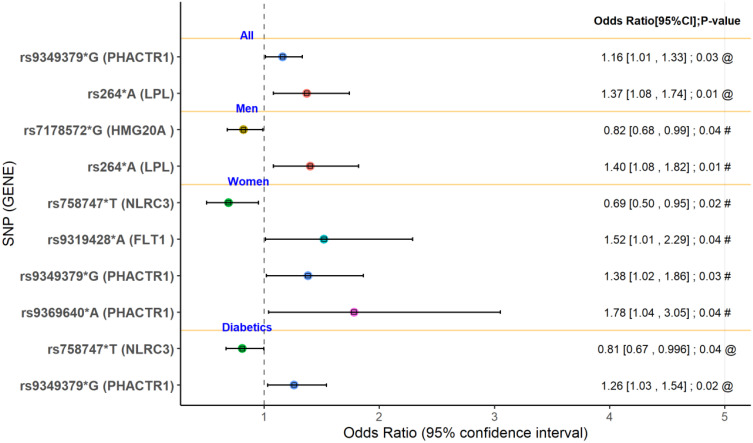
Figure 2.
Forest plot of the logistic regression with restenosis as an outcome and SNPs that have been associated with CAD and T2D as predictor variables according to gender and diabetes. Restenosis: patients with CAD >50% obstruction and history of percutaneous stent deployment. @: adjusted for age and sex. #: adjusted for age.
Abbreviations: CI, Confidence Interval; SNPs, single nucleotide polymorphisms; HMG20A, high mobility group 20A. LPL; lipoprotein lipase. NLRC3, NLR family CARD domain containing 3. FLT1; fms related receptor tyrosine kinase 1; PHACTR1, phosphatase and actin regulator 1.

