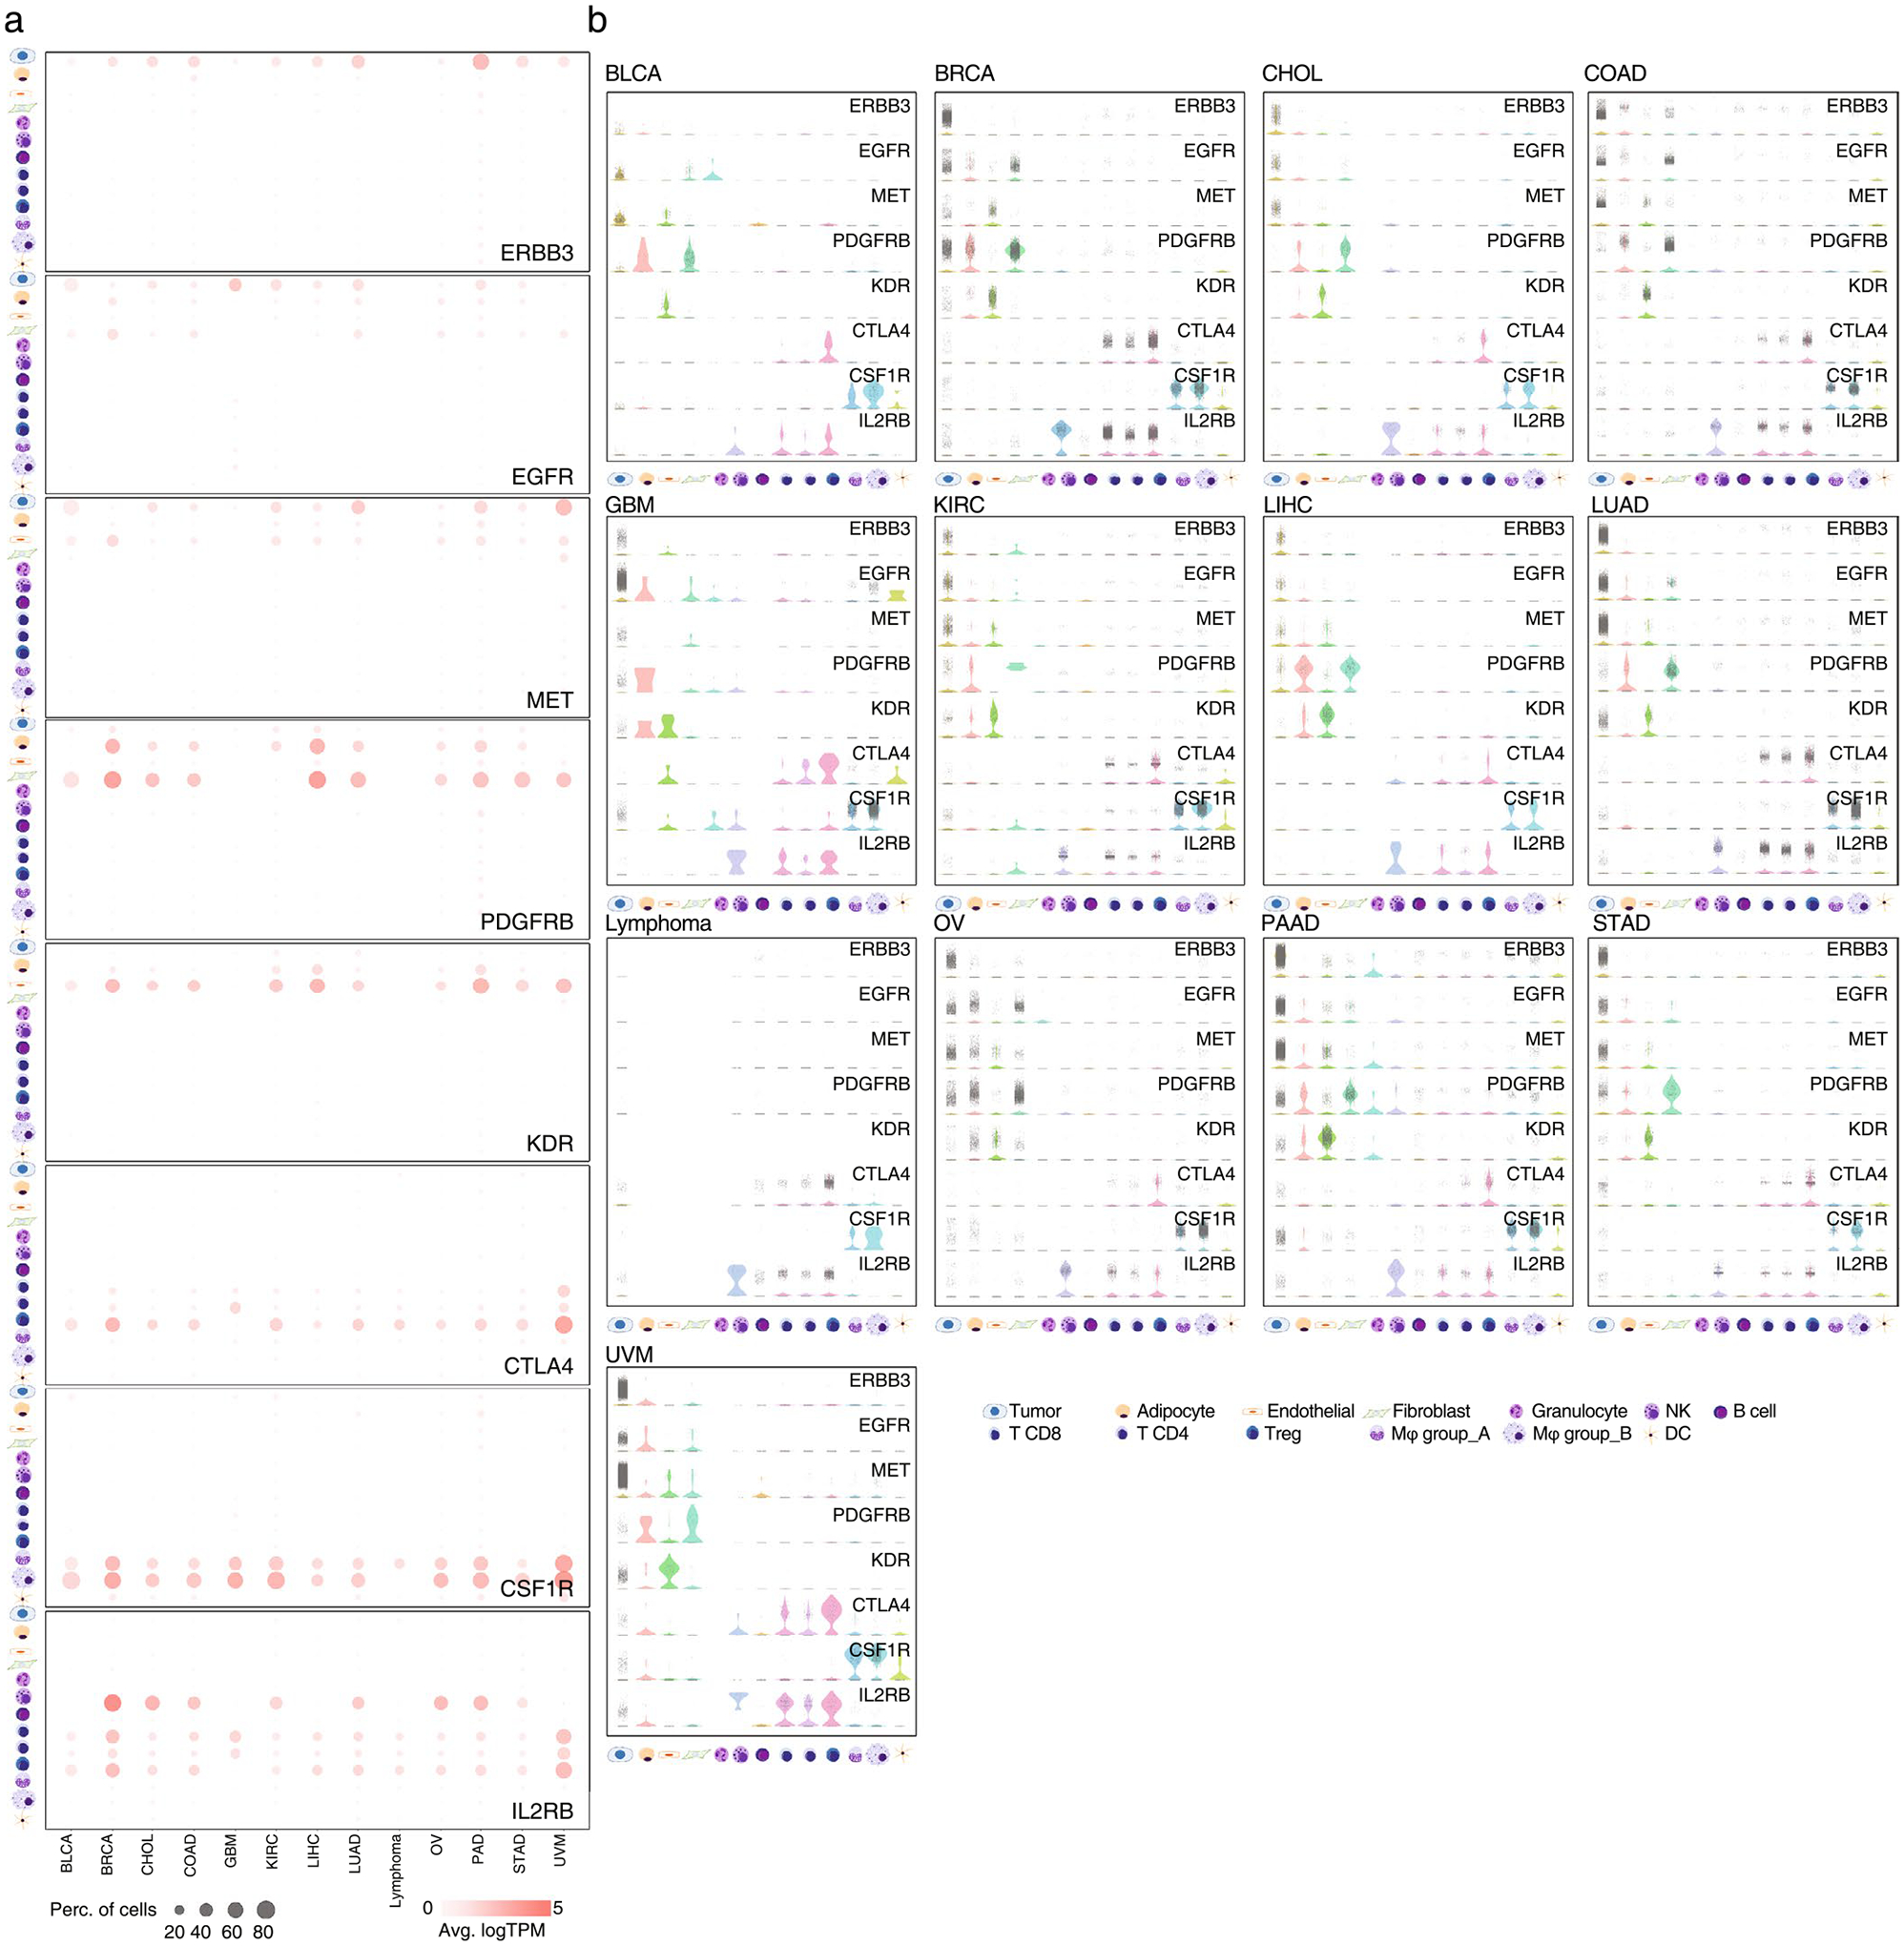
Extended Data Fig. 2 |. GESPs specifically express in distinct cell populations in tumor microenvironment.

a, Bubble plots show expression levels and percentages of the cells expressing ERBB3, EGFR, MET, PDGFRB, KDR, CTLA4, CSF1R, or IL2RB in each cell population across 13 cancer types. Bubble size: percentage of positive cells; intensity of color: expression level. b, Violin plots show gene expression levels of ERBB3, EGFR, MET, PDGFRB, KDR, CTLA4, CSF1R, and IL2RB in each cell population at single cell. Each plot presents expression level in one cell.
