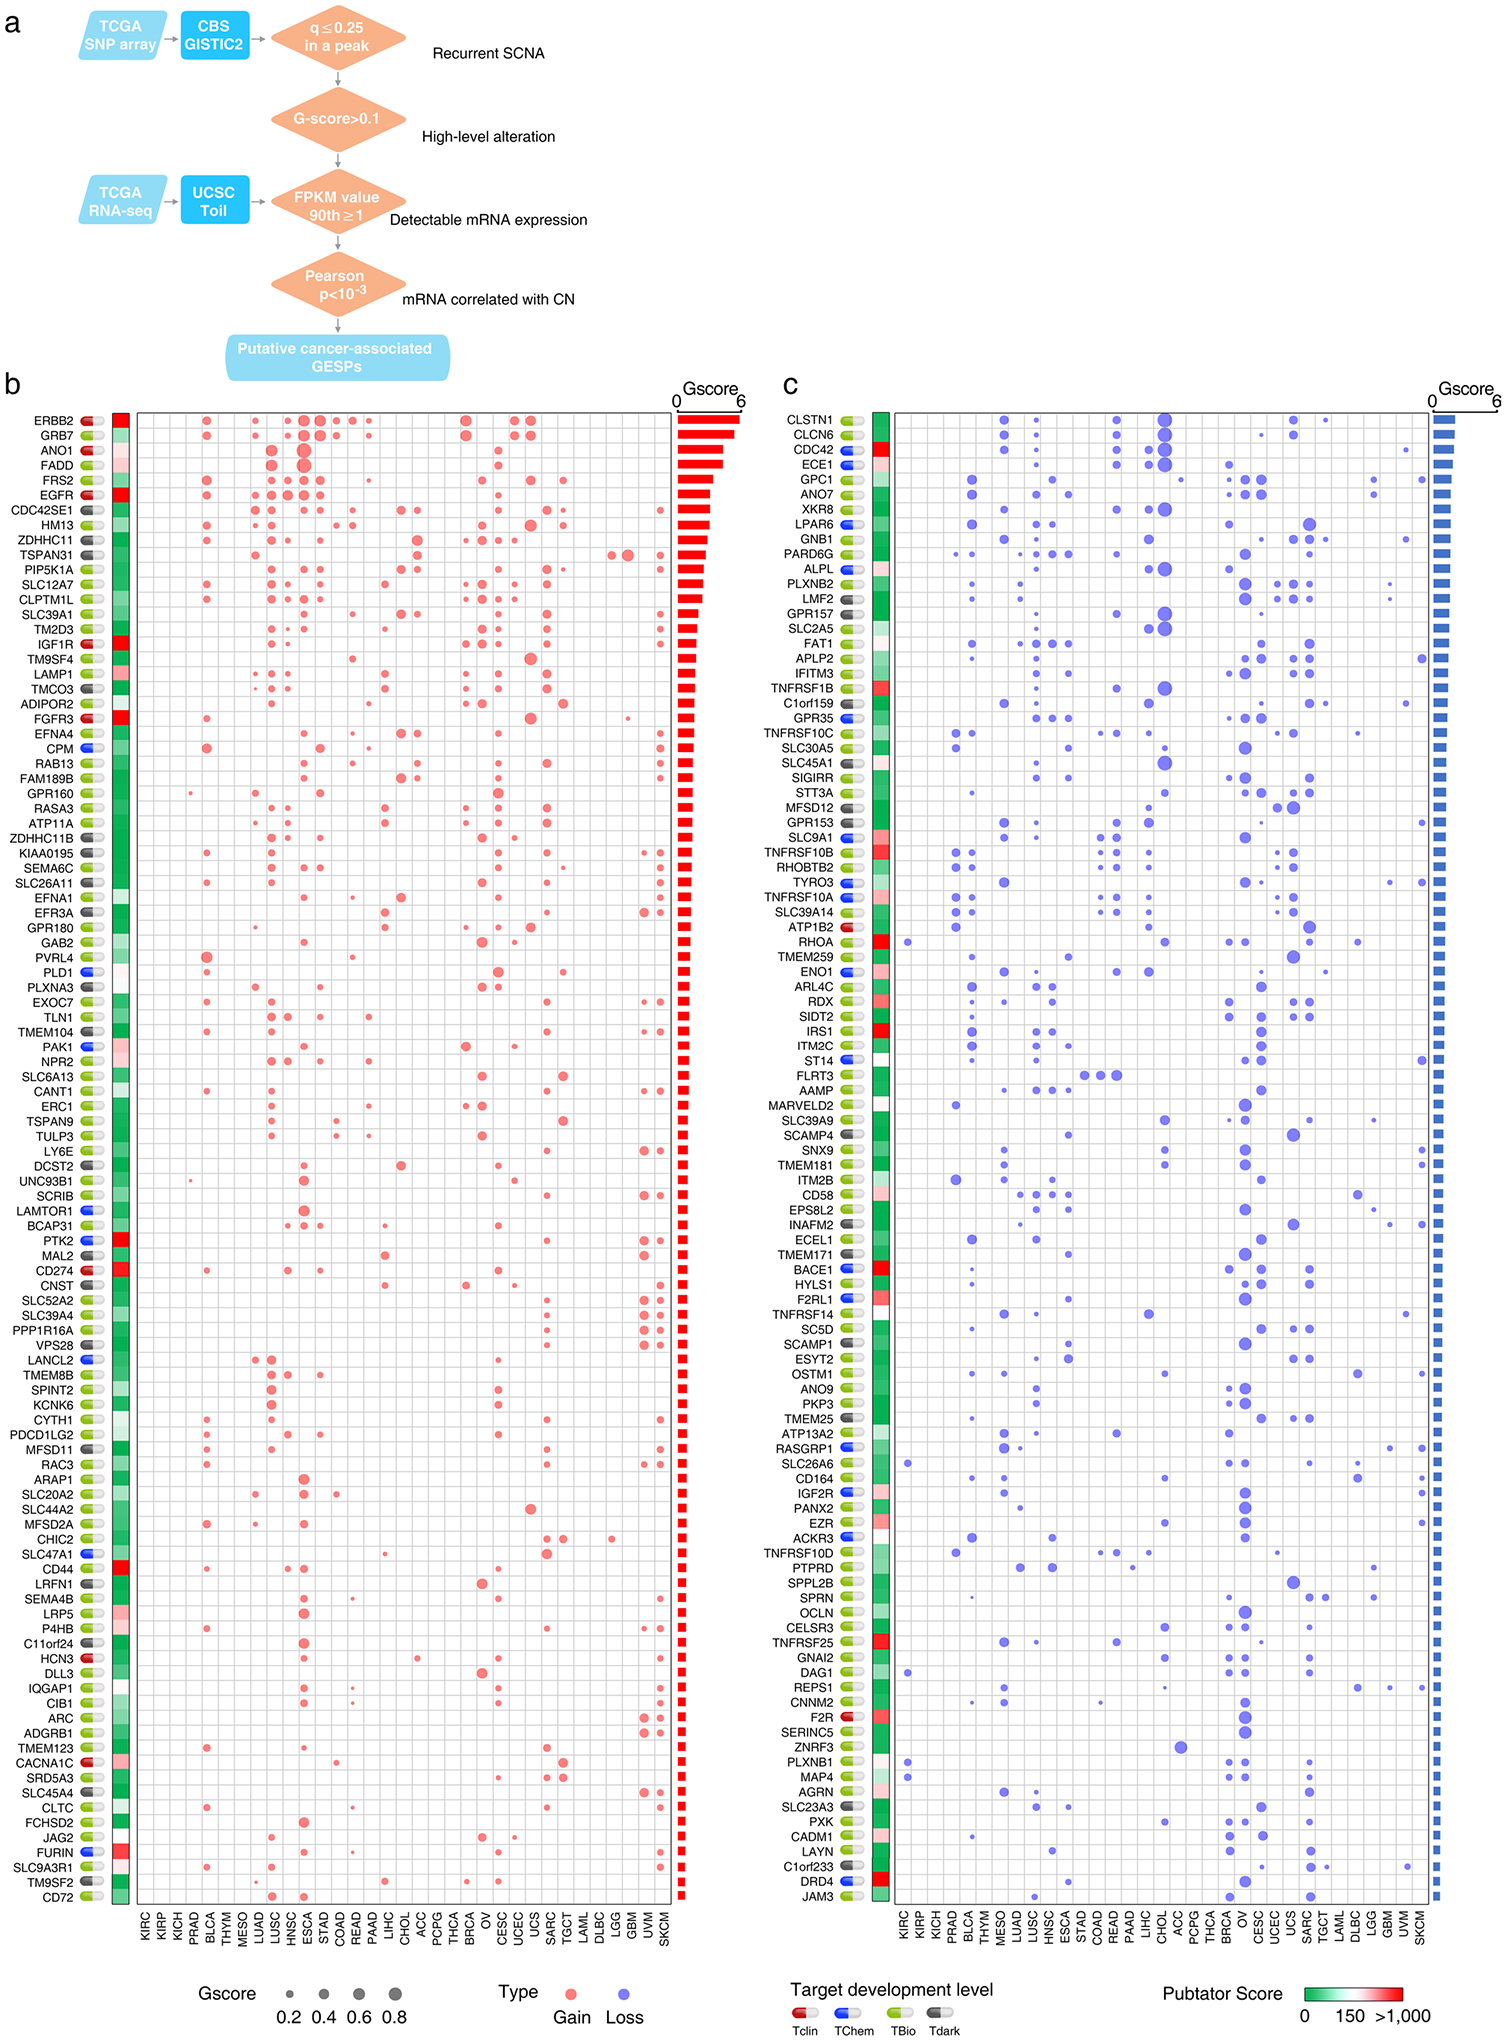
Extended Data Fig. 5 |. Somatic copy number alterations of the GESPs across cancers.

a, The workflow of somatic copy number alteration analysis. Four criteria were used to identify the putative cancer-causing GESPs driven by SCNAs in each cancer type. b and c, Bubble plot shows the SCNA G-scores, which consider both the amplitudes of the aberrations and the frequencies of their occurrence across samples, of the putative cancer-causing GESPs driven by SCNAs in each cancer type. b, copy number gain; c, copy number loss. The size of the bubble: G-score; red: gain; blue: loss. Pubtator scores, which represent the number of publications for a given gene and were retrieved from Pubtator database, are shown next to G-score plot. Green: 1–150 (understudied genes); Red: >150. Target development levels of each gene, which were retrieved from PHAROS database, are shown in the left. Red: Tclin; blue: TChem; green: Tbio; grey: Tdark. Genes are ordered according to overall G-score (from largest values to smallest values). Top 100 GESPs with highest overall G-score were shown.
