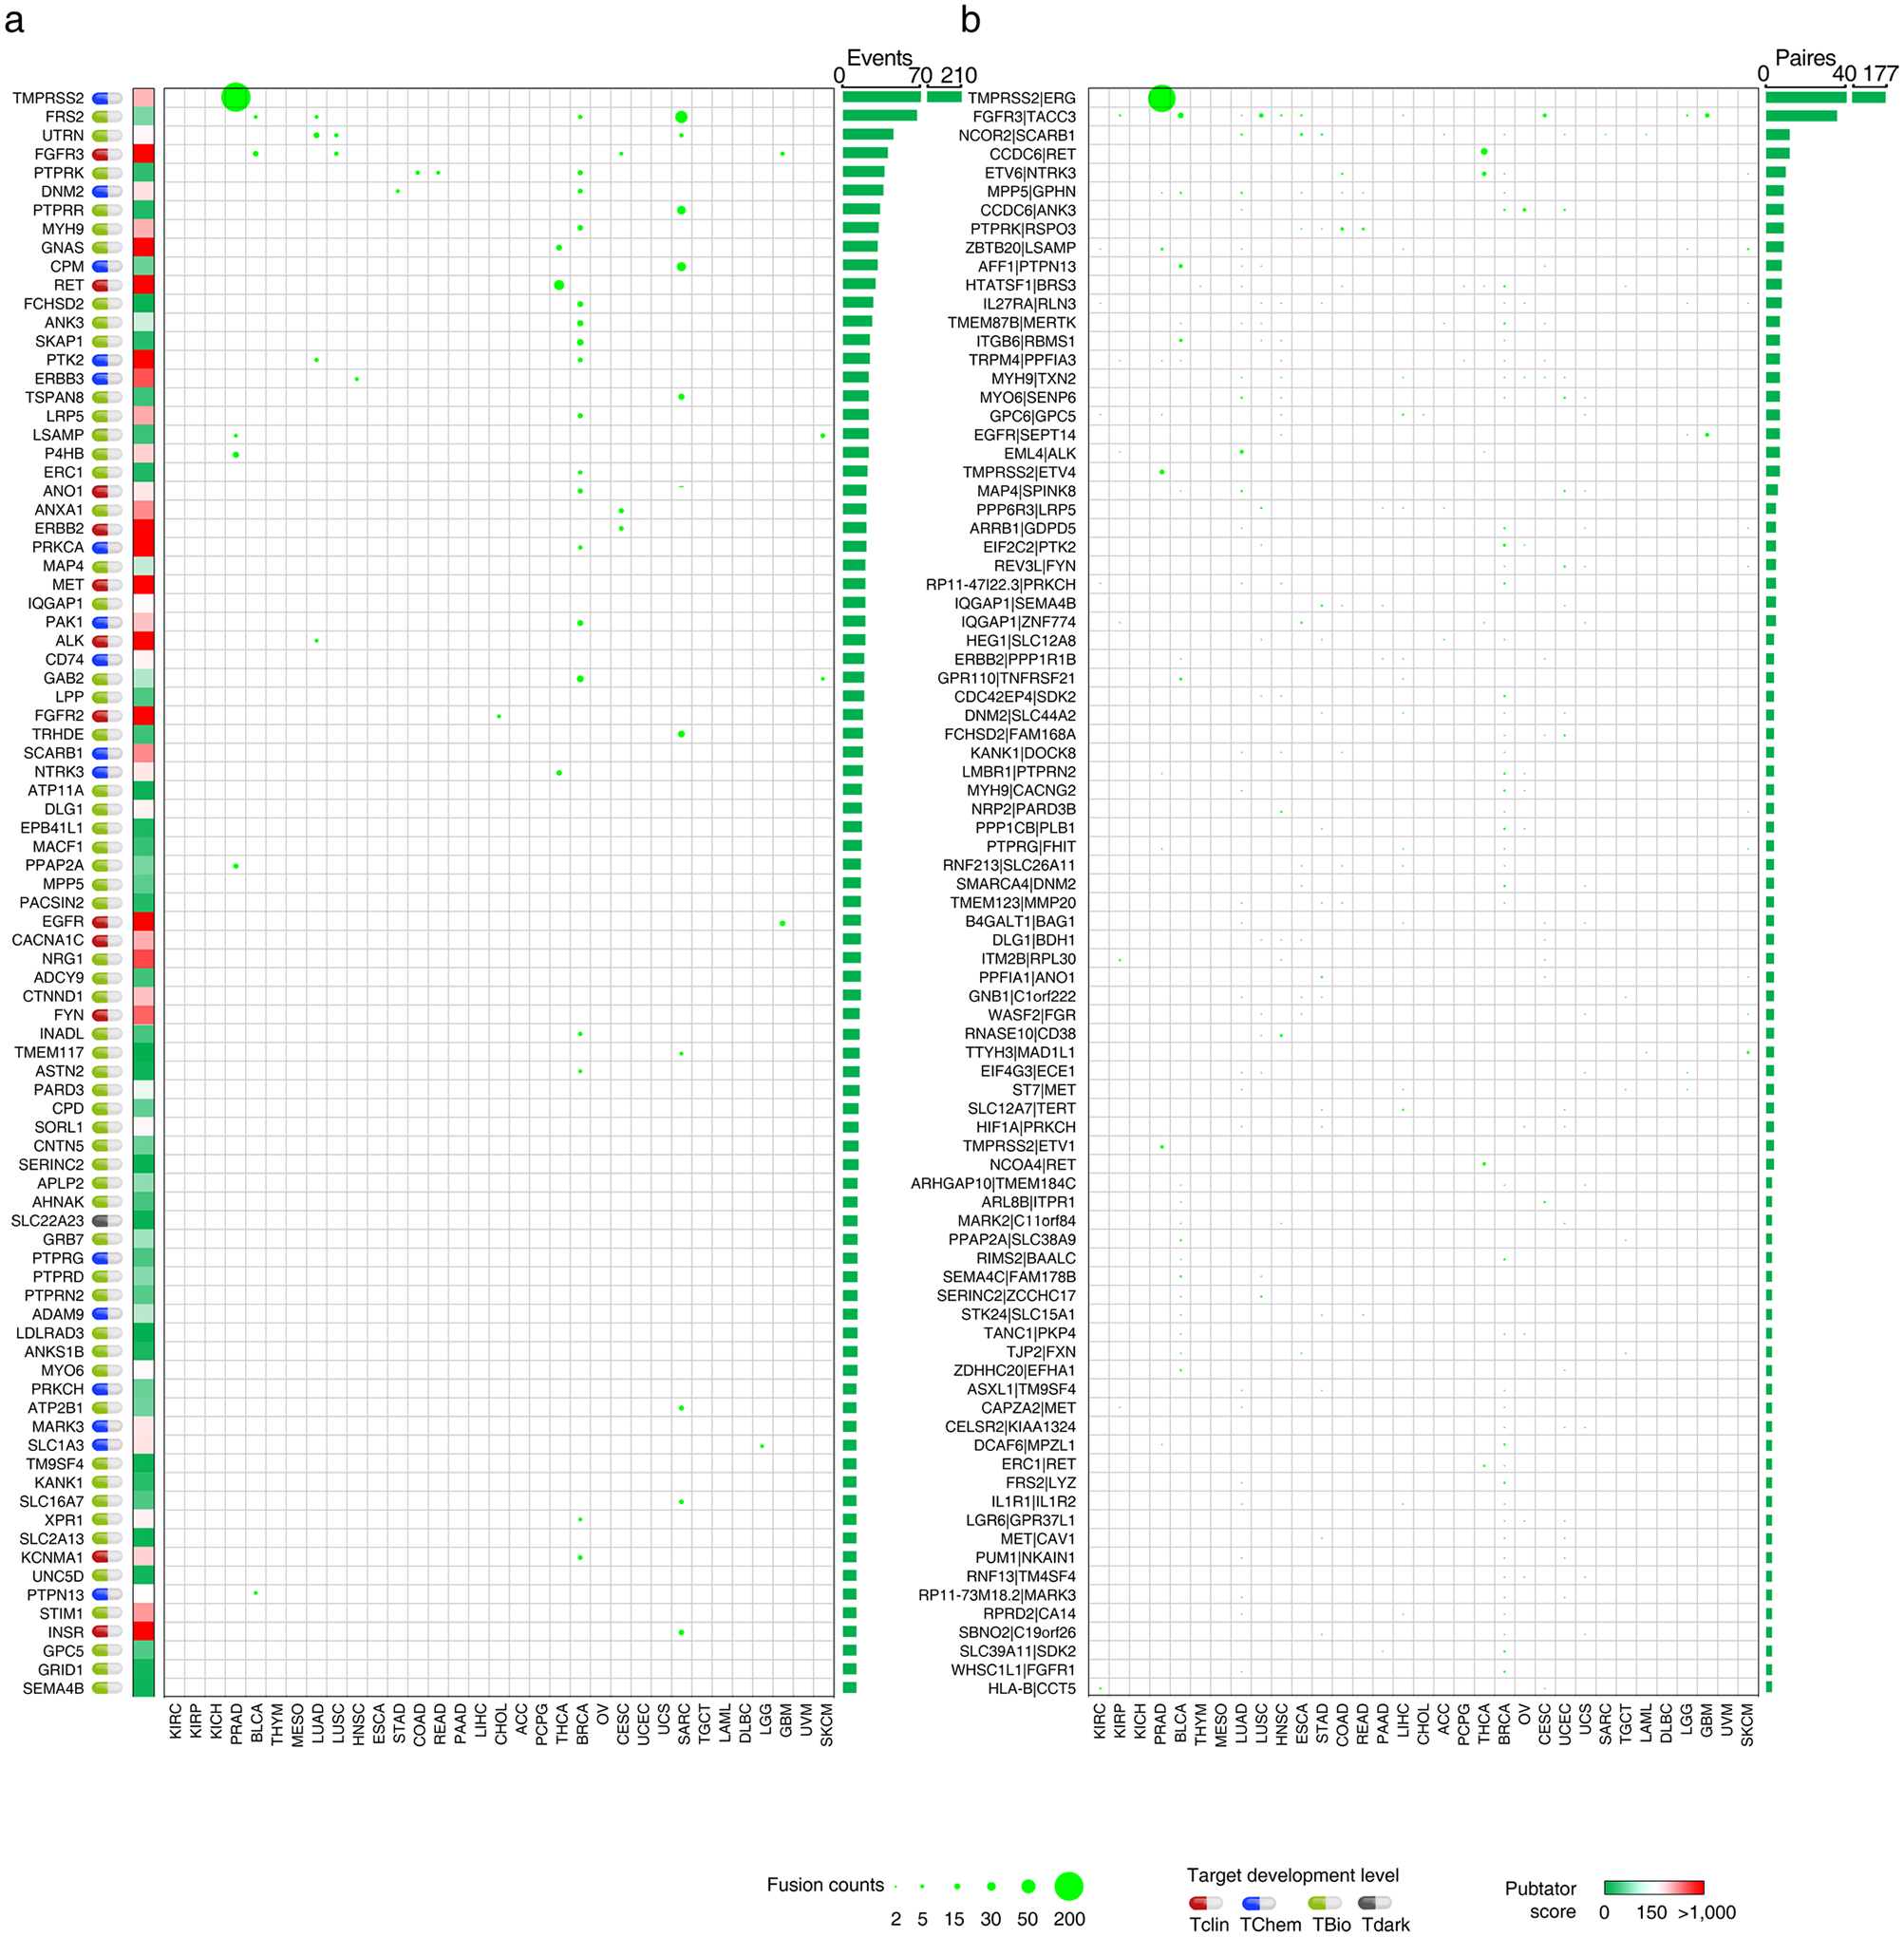
Extended Data Fig. 7 |. Transcript fusions of the GESPs across cancers.

a, Summary of the GESP transcript fusion events across cancers. The size of the bubble: number of the GESP transcript fusion events across 33 cancer types. Pubtator scores, which represent the number of publications for a given gene and were retrieved from Pubtator database, are shown the next to bubble plot. Green: 1–150 (understudied genes); Red: >150. Target development levels of each gene, which were retrieved from PHAROS database, are shown in the left. Red: Tclin; blue: TChem; green: Tbio; grey: Tdark. Genes are ordered according to the overall number of the fusion events (from largest values to smallest values). Top 86 GESPs with highest number of fusion events (≥12) were shown. b, Summary of the GESP transcript fusion pairs across cancers. The size of the bubble: number of the GESP transcript fusion pairs across 33 cancer types. Fusion pairs are ordered according to the overall recurrent pairs number (from largest values to smallest values). Top 86 GESP transcript fusion pairs were shown.
