
Extended Data Fig. 9 |. Characterization of membrane-bound immunological accessory molecules (mIAMs) in cancers.
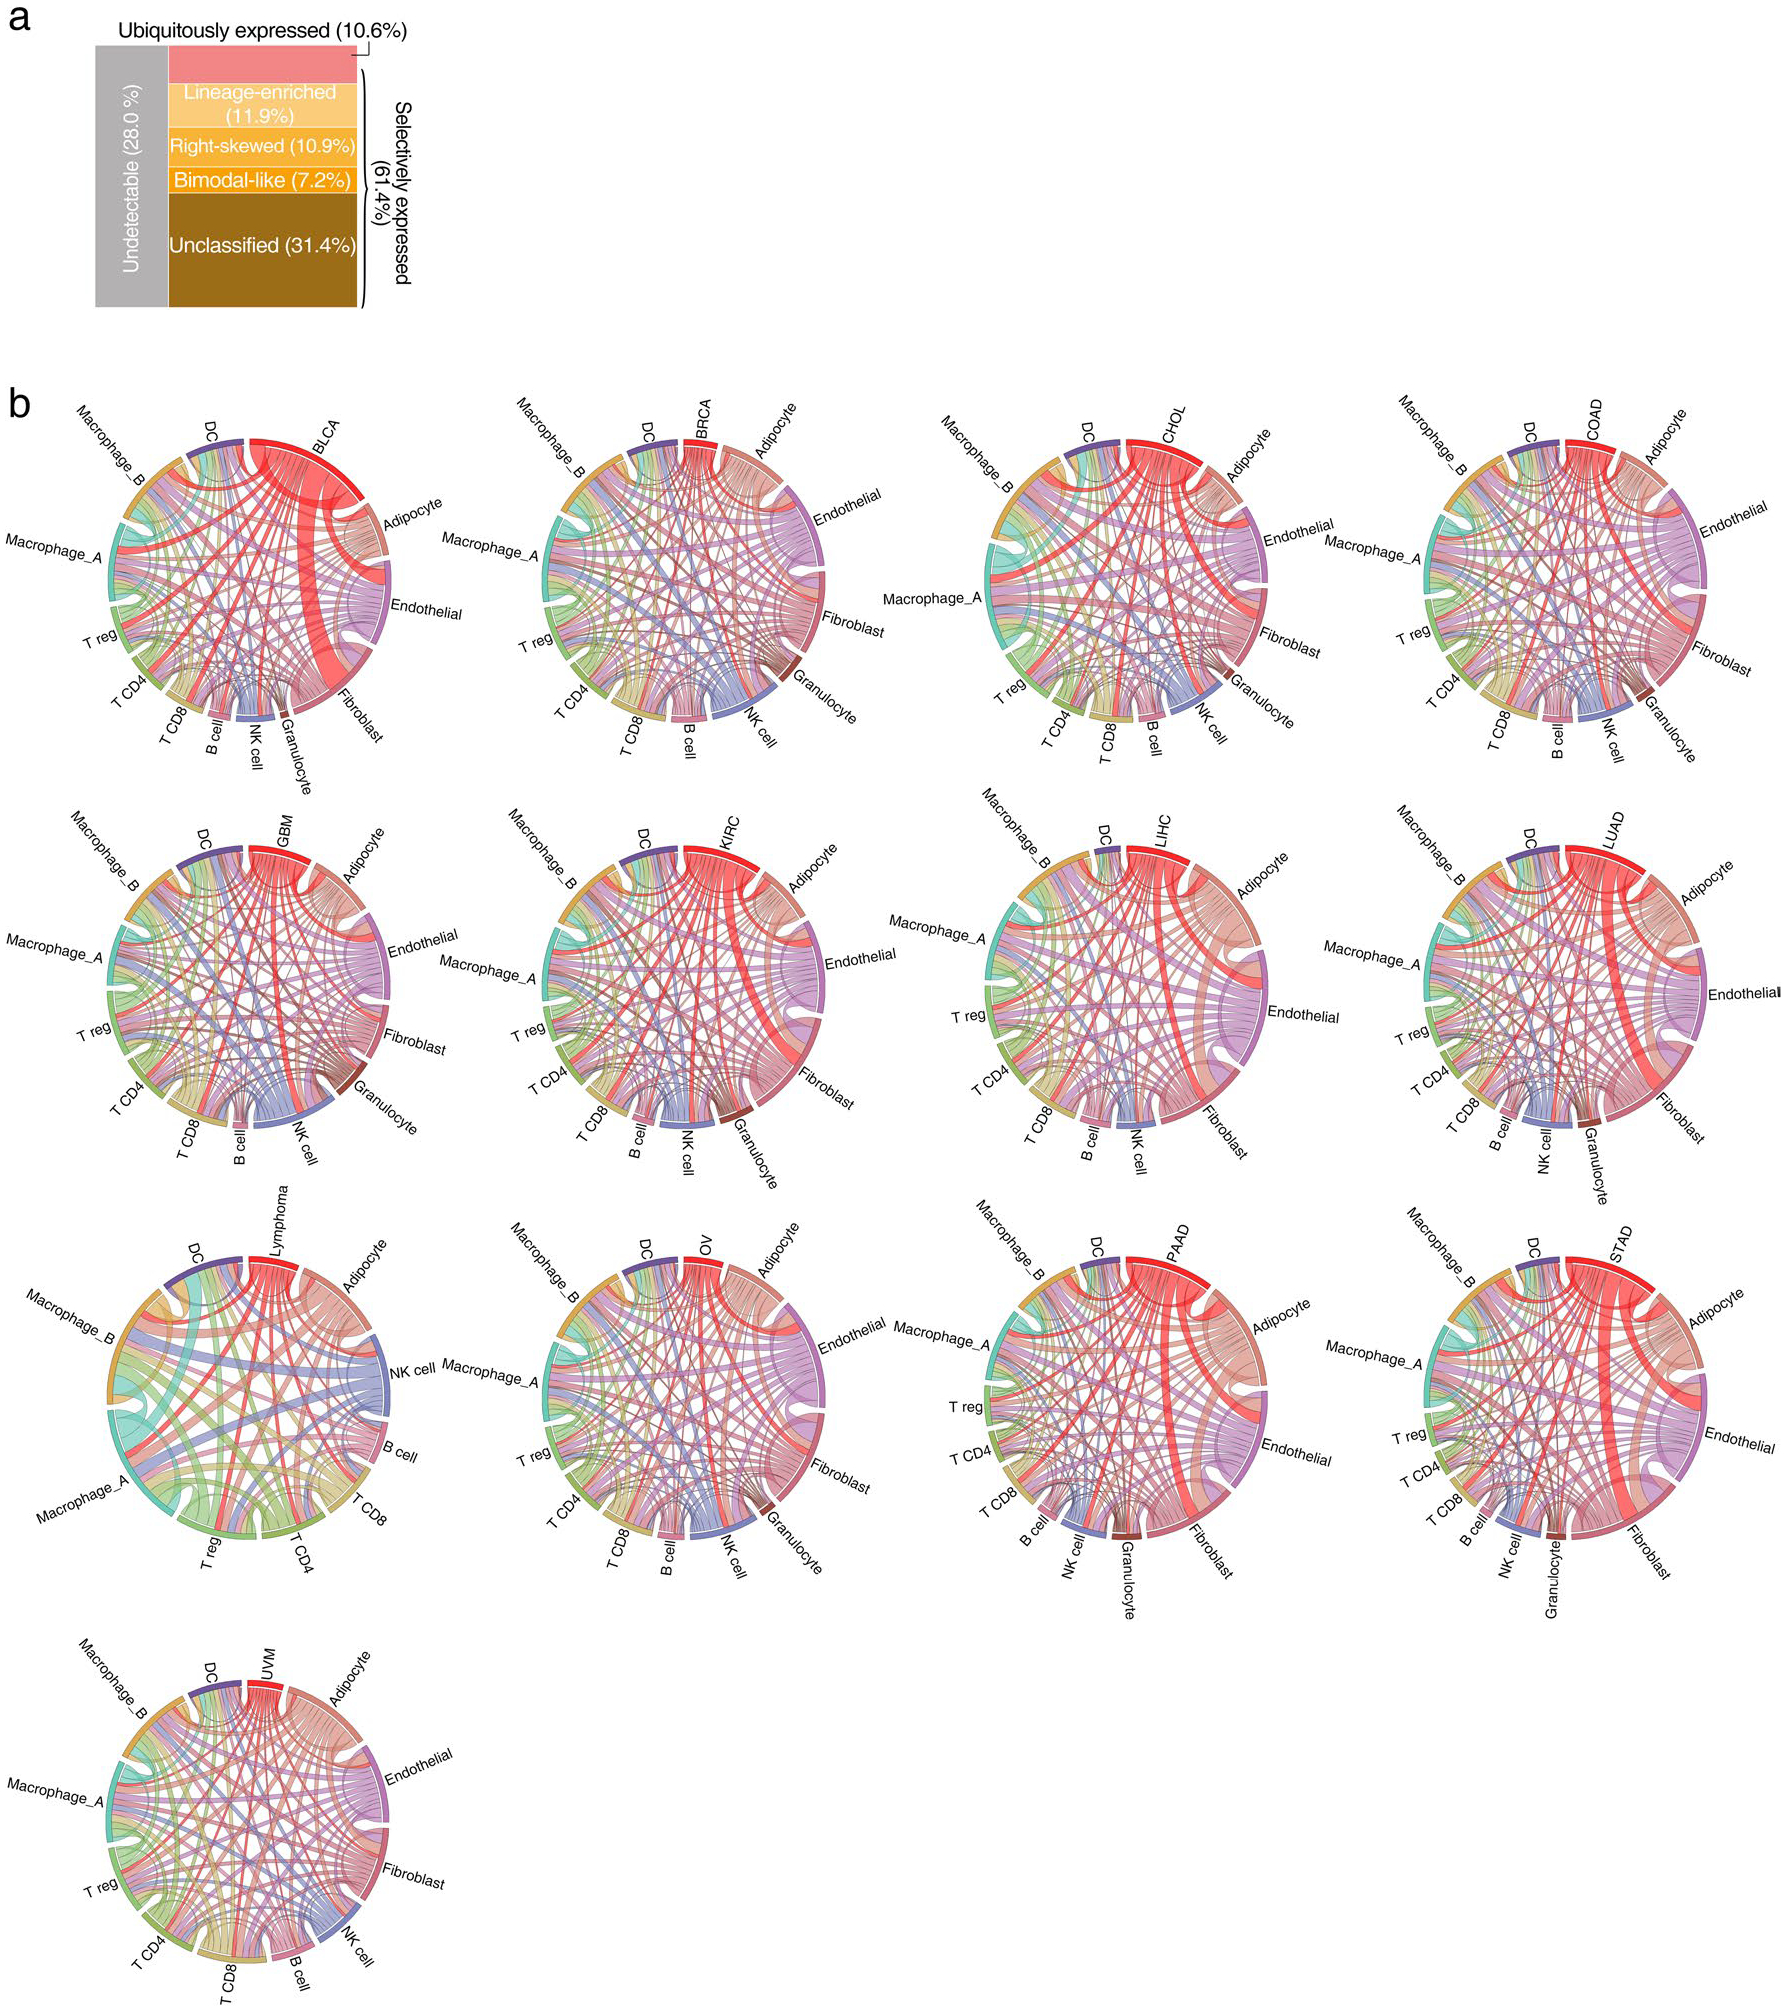
a, Mosaic plot shows the classification of mIAMs based on their expression patterns across cancer cell lines from non-hematological malignancies. b, Circos plot shows the number of mIAMs-associated interactions between cell types across 13 cancer types. Paired cell types with significant cell-cell interactions identified by CellPhoneDB were connected by lines. The width of the lines indicates normalized number of mIAMs-associated interactions between two cell types.